

AI Supertrend MTF
Gösterge
3 satın almalar
Sürüm 1.0, Jul 2026
Windows, Mac

534.4M
İşlem hacmi
9.76M
Kazanılan pip
4
Satışlar
Açıklama
Genel Bakış:
Geleneksel Supertrend göstergesinin ani piyasa değişikliklerinin gerisinde kalmasından bıktınız mı? AI Supertrend MTF K-En Yakın Komşular (K-NN) Makine Öğrenimi algoritmasını entegre ederek trend takibini yeniden tanımlıyor. En son fiyat hareketlerinden (RSI, ATR, Momentum) sürekli öğrenir ve dalgalı piyasalarda yanlış sinyalleri ortadan kaldırmak için hassasiyetini otomatik olarak ayarlarken, büyük kırılmaları anında yakalar.
Ana Özellikler:
- 🤖 Makine Öğrenimi Motoru: Gerçek trendler ile piyasa gürültüsünü ayırt etmek için genişleyen bir hafıza bankası ve dinamik özellik ağırlıklandırması kullanır.
- 📊 Çoklu Zaman Dilimi (MTF) Projeksiyonu: Daha büyük resmi görün! İki üst zaman dilimini (örneğin, 1H ve Günlük) doğrudan mevcut alt zaman dilimi grafiğinize yansıtın. Sıfır yeniden boyama ve gelecek veri sızıntısı garantisi için titiz bit düzeyinde mantıkla tasarlanmıştır.ZERO repainting ve gelecek veri sızıntısı yoktur.
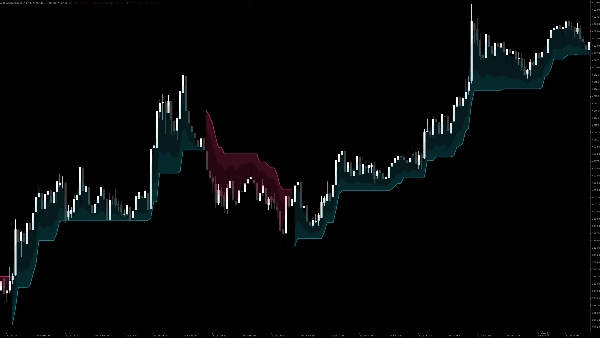
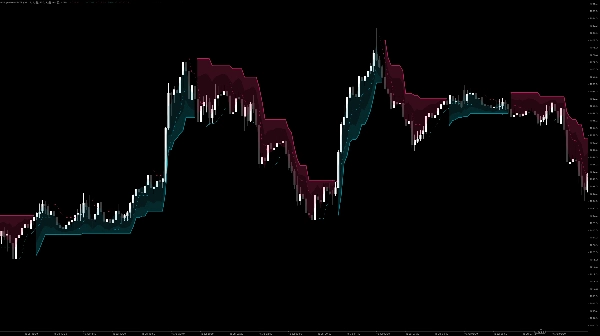
- ✨ Dinamik Parlayan Bulutlar: Muhteşem bir görsel yükseltme. Mevcut trendin gücünü ve destek/direnç bölgelerini görsel olarak göstermek için yumuşak, müdahale etmeyen 3 katmanlı gradyan bulutlar sunar.
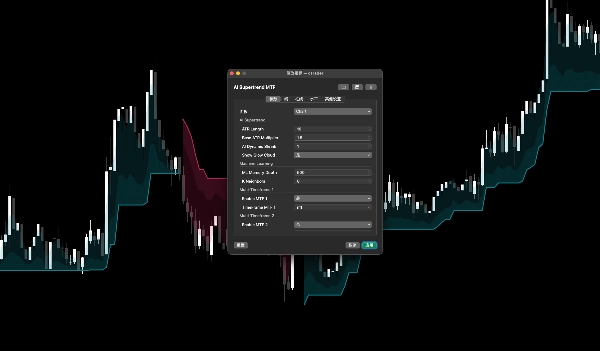
- ⚙️ Yüksek Derecede Özelleştirilebilir: AI Hafıza Derinliği, K-Komşular ve MTF ayrıntılarını doğrudan cTrader yerel parametre panelinden ayarlayın.
Nasıl Kullanılır (Kullanıcı Kılavuzu):
- Grafiğe Ekle: Göstergeleri favori zaman diliminize uygulayın. Ana trend çizgisi hemen mevcut AI hesaplamalı yönü gösterecektir.
- MTF'yi Etkinleştir (İsteğe Bağlı): Ayarlar içinde aşağı kaydırarak
Multi-Timeframe 1veMulti-Timeframe 2seçeneklerini bulun. "Enable" kutusunu işaretleyin ve istediğiniz üst zaman dilimlerini seçin. Kesikli çizgiler makro trendi gösterecektir. - Ticaret Stratejisi:
-
- Alış Sinyali: Ana trend çizgisi Cyan'a (fiyatın altında) döndüğünde VE MTF üst zaman dilimi çizgileri de Cyan olduğunda (Trend Hizalaması).
- Satış Sinyali: Ana trend çizgisi Kırmızı'ya (fiyatın üzerinde) döndüğünde VE MTF üst zaman dilimi çizgileri de Kırmızı olduğunda.
- Çıkış: Parlayan bulut bantlarını dinamik takip eden stop-loss seviyeleri olarak kullanın.
Özet
AI summary
AI Supertrend MTF is a trend-following indicator that integrates a K-Nearest Neighbors (K-NN) machine learning algorithm to reduce lag and false signals typical of traditional Supertrend indicators. It continuously learns from recent price action metrics including RSI, ATR, and momentum, adapting its sensitivity to distinguish true trends from market noise and to capture breakouts promptly.
Key features include multi-timeframe (MTF) projection, allowing users to overlay trend information from up to two higher timeframes onto the current chart without repainting or future data leaks. The indicator visually represents trend strength and support/resistance zones through dynamic, three-layer glowing clouds. Users can customize AI memory depth, K-neighbors, and MTF settings via the native parameter panel.
To use, apply the indicator to any timeframe to see the AI-calculated trend direction. Optional MTF lines display macro trends from higher timeframes. Buy and sell signals are generated when the main trendline and MTF lines align in color (cyan for buy, red for sell). The glowing cloud bands serve as dynamic trailing stop-loss levels.
This indicator supports visualization, signals, and filtering functions, and requires bar, tick, and volume data inputs. It is categorized under trend indicators and incorporates RSI and ATR for momentum and volatility analysis.
Key features include multi-timeframe (MTF) projection, allowing users to overlay trend information from up to two higher timeframes onto the current chart without repainting or future data leaks. The indicator visually represents trend strength and support/resistance zones through dynamic, three-layer glowing clouds. Users can customize AI memory depth, K-neighbors, and MTF settings via the native parameter panel.
To use, apply the indicator to any timeframe to see the AI-calculated trend direction. Optional MTF lines display macro trends from higher timeframes. Buy and sell signals are generated when the main trendline and MTF lines align in color (cyan for buy, red for sell). The glowing cloud bands serve as dynamic trailing stop-loss levels.
This indicator supports visualization, signals, and filtering functions, and requires bar, tick, and volume data inputs. It is categorized under trend indicators and incorporates RSI and ATR for momentum and volatility analysis.
Gösterge profili
Gösterge kategorisi
Trend
Çıktı türü
Görselleştirme
Filtre
Sinyaller
Veri gereklilikleri
Yalnızca çubuklar
Tick verisi
Hacim
Desteklenen sinyaller
Kesişim
Kırılma
Yön değiştirme
Trend gücü
Volatilite
Seviye kırılması
Müşteri değerlendirmeleri
0.0
Değerlendirmeler: 0
Müşteri değerlendirmeleri
Bu ürün için henüz bir değerlendirme yok. Ürünü denediniz mi? O zaman ona dair görüşlerini paylaşan ilk kişi olun!
Tartışma
SSS
Supertrend
RSI
ATR
cTrader Store üzerinden erişilebilen işlem botları, göstergeler ve eklentiler gibi ürünler, üçüncü taraf sağlayıcılar tarafından sağlanır ve yalnızca bilgilendirme ve teknik erişim amaçlarıyla sunulur. cTrader Store bir broker değildir ve yatırım tavsiyesi, kişisel öneriler vermez veya gelecekteki performansı garanti etmez.
Bu oluşturanın diğer ürünleri




!["Wyckoff Toolkit [Iridio Capital]" logosu](https://cdn.ctrader.com/image/webp/5318c788-91ef-4297-bca6-4ce73b1516a8_61556)

















Fiyat
534.4M
İşlem hacmi
9.76M
Kazanılan pip
4
Satışlar