
Multi Time Frame Candles FVG Liqudity smc
지표
5 구매
버전 2.0, Jun 2026
Windows, Mac
4.5
리뷰: 2
설명
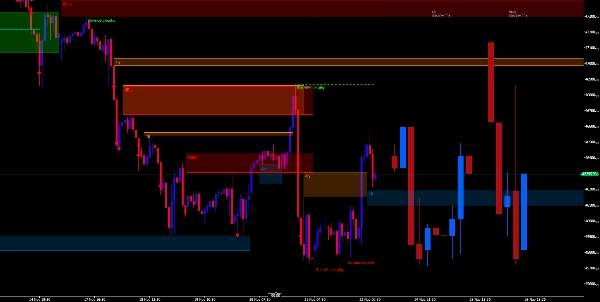
다중 시간 프레임 캔들스틱 FVG와 BSL/SSL 프리미엄 스위트는 시장 분석을 단순화하기 위해 설계된 고정밀 스마트 머니 콘셉트 도구입니다. 이 도구는 다중 시간 프레임 캔들스틱 구조, 공정 가치 갭, 그리고 매수측/매도측 유동성 (BSL/SSL)을 하나의 깔끔하고 빠르며 시각적으로 프리미엄인 지표로 결합합니다.
이 프리미엄 에디션에는 다음이 포함됩니다:
🔷 다중 TF 캔들스틱 오버레이
🔷 스마트 머니 유동성 (BSL & SSL)
🔷 다중 시간 프레임 FVG 탐지
⭐ 사용 지침
1️⃣ 지표 적용
다음 용도로 최대 3개의 상위 시간 프레임을 선택하세요:
- 캔들스틱 오버레이
- FVG 탐지
- 유동성 매핑
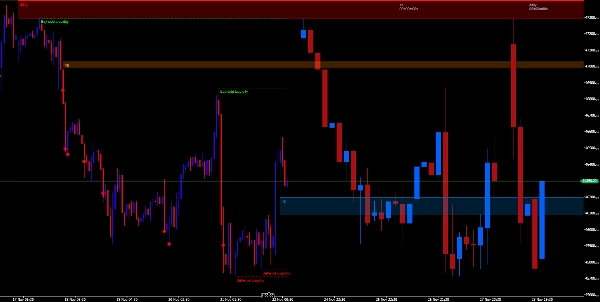
2️⃣ 유동성 구역 해석
- BSL (매수측 유동성): 스윙 고점 위의 유동성 목표.
- SSL (매도측 유동성): 스윙 저점 아래의 유동성 목표.
가격이 이 구역을 스윕할 때 → 반전 또는 완화 가능성이 높음.
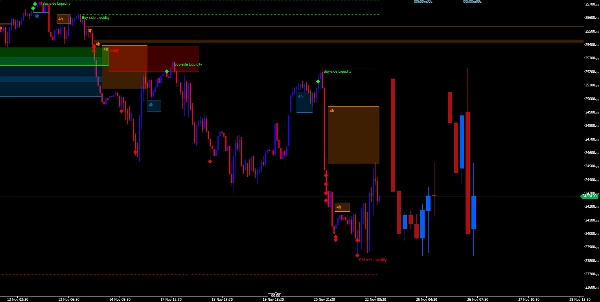
3️⃣ MTF FVG를 사용하여 기관 불균형 식별
- 강세 FVG → 수요 불균형 가능성
- 약세 FVG → 공급 불균형 가능성
가장 강력한 신호를 위해 HTF 구조와 결합하세요.
4️⃣ 추세 확인을 위해 MTF 캔들 사용
HTF 캔들은 다음을 보여줍니다:
- 진정한 추세 방향
- 거부 심지
원시 다중 시간 프레임 차트를 보는 것보다 더 명확함.
5️⃣ 높은 신뢰도의 진입을 위해 세 가지 모두 결합
A+ 설정은 다음과 같은 경우 발생합니다:
✔ HTF 캔들 방향이 일치할 때
✔ 유동성 스윕이 발생할 때
✔ 완화 또는 지속 방향으로 FVG가 형성될 때
면책 조항:
거래에는 위험이 따르며 과거 실적이 미래 결과를 보장하지 않습니다. 라이브 시장에서 사용하기 전에 항상 데모에서 테스트하세요.
거래 결정은 본인의 책임입니다.
요약
AI 요약
Multi Time Frame Candles FVG Liquidity SMC is an indicator integrating Smart Money Concepts for enhanced market analysis. It overlays candlestick structures from up to three higher timeframes, detects Fair Value Gaps (FVG) indicating potential institutional imbalances, and maps Buy-Side Liquidity (BSL) and Sell-Side Liquidity (SSL) zones. BSL targets liquidity above swing highs, while SSL targets liquidity below swing lows; price sweeps of these zones may signal reversals or mitigations. The indicator aids in trend confirmation by revealing higher timeframe candle directions and rejection wicks, offering clearer insights than raw multi-timeframe charts. Combining multi-timeframe candlesticks, liquidity zones, and FVG detection supports identification of high-confidence trade entries when these elements align. It is applicable across various markets including Forex, cryptocurrencies, indices, commodities, and stocks, supporting symbols such as BTCUSD, EURUSD, GBPUSD, XAUUSD, and NAS100. Users select timeframes for overlays, FVG detection, and liquidity mapping to tailor analysis. The tool is designed for traders employing breakout, scalping, and Smart Money Concept strategies. Trading risk disclaimer applies; users should test on demo accounts before live use.
지표 프로필
고객 리뷰
4.5
리뷰: 2
5 | 50 % | |
4 | 50 % | |
3 | 0 % | |
2 | 0 % | |
1 | 0 % |
상담
자주 묻는 질문(FAQ)
BTCUSD
Forex
Breakout
Indices
EURUSD
Commodities
GBPUSD
NZDUSD
Prop
ZigZag
Scalping
Fair Value Gap
SMC
Crypto
Stocks
XAUUSD
NAS100
USDJPY
트레이딩 봇, 지표, 플러그인 등 cTrader Store에서 제공되는 상품은 제3자 개발자에 의해 제공되며, 이는 단순히 정보 및 기술적 접근을 목적으로 제공된 것입니다. cTrader Store는 중개인이 아니며, 투자 조언, 개인별 추천 또는 향후 성과에 대한 어떠한 보장도 제공하지 않습니다.
이 작성자의 상품 더 보기


가격
가입일 22/06/2025
79
판매
79
무료 설치