
설명
“초기 범위” 지표란 무엇인가요?
이 지표는 Pine Script의 “Opening Range Breakout” 도구를 포팅한 것입니다.
원래는 ORB – Opening Range Breakout라고 불렸습니다: 세션의 첫 몇 분 동안의 가격 범위를 취한 다음, 그 범위의 돌파를 거래하는 방식입니다.
이 버전에서는 이름을 IR – Initial Range로 변경했지만, 아이디어는 동일합니다:
- 지표는 여러 개의 초기 범위를 생성합니다:
-
- IR5 – 첫 5분
- IR15 – 첫 15분
- IR30 – 첫 30분
- IR60 – 첫 60분
- 각 IR에 대해 다음이 있습니다:
-
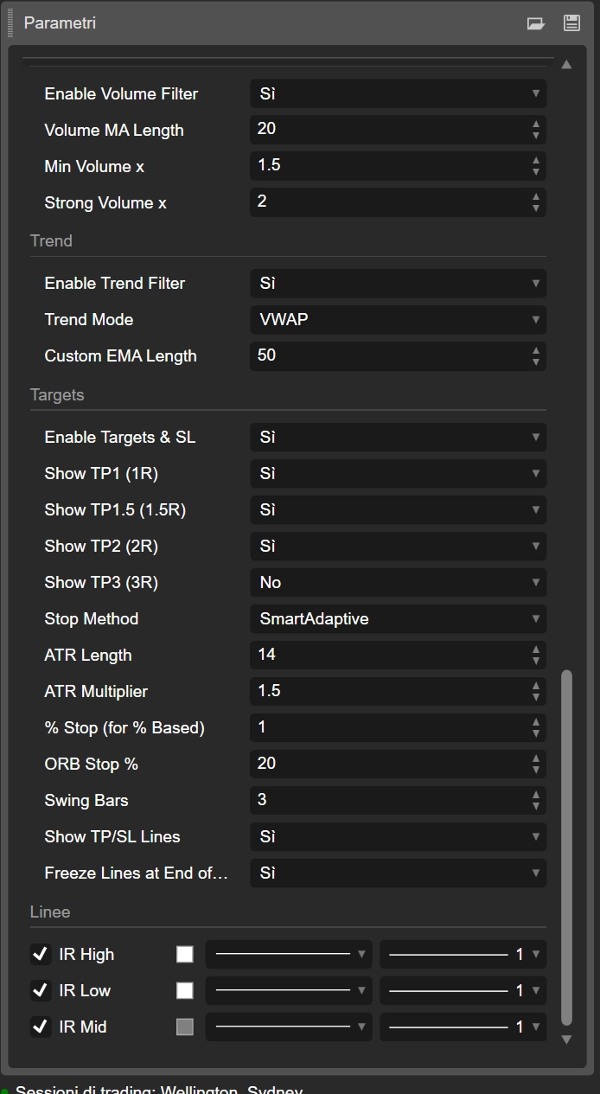
- IR High
- IR Low
- IR Mid (범위의 중간 지점)
- 활성화할 범위와 사용할 색상을 선택할 수 있습니다.
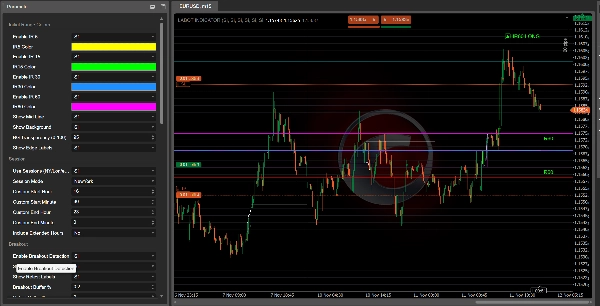
범위가 완성되면, 지표는 가격이 그 범위를 돌파하는지 확인합니다:
- IR High 위로 돌파 → IR60 LONG, IR30 LONG 등
- IR Low 아래로 돌파 → IR60 SHORT, IR30 SHORT 등
이 라벨들은 차트에 표시되어 어떤 초기 범위가 신호를 생성했는지 빠르게 확인할 수 있습니다.
필터 및 확인
이 지표는 여러 필터를 결합하여 무작위 돌파를 방지하도록 설계되었습니다:
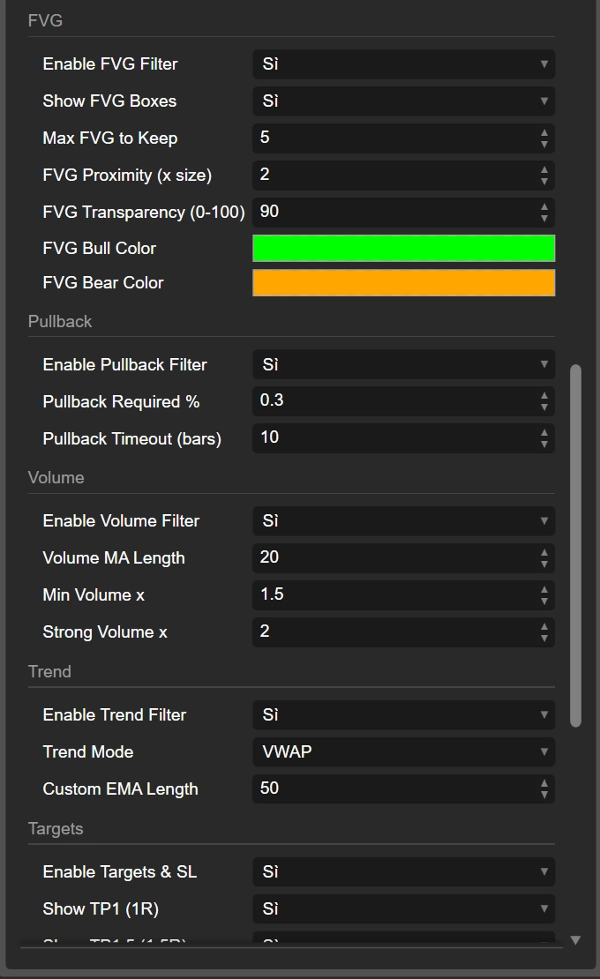
- 추세 필터
다음 중 사용할 수 있습니다: -
- VWAP
- EMA
- 사용자 지정 EMA 길이
- VWAP + EMA 함께 사용
추세 방향의 돌파가 우선시됩니다 (예: 가격이 VWAP/EMA 위에 있을 때만 LONG).
- 거래량 필터
지표는 현재 거래량을 거래량 이동평균과 비교합니다: -
- “일반” 확인
- “강한” 거래량
원하는 경우 약한 거래량의 돌파는 무시할 수 있습니다.
- FVG (공정 가치 격차) 필터
강세 및 약세 FVG를 감지하며, 돌파가 관련 FVG 근처에서 발생해야 할 수도 있습니다: -
- IR High 근처의 강세 FVG는 LONG을 지원합니다
- IR Low 근처의 약세 FVG는 SHORT을 지원합니다
- 풀백 필터
돌파 후 최소 풀백과 그 풀백이 발생할 시간 창(바 단위)을 요구할 수 있습니다. 이는 실제로 “숨을 쉬는” 돌파에 집중하는 데 도움이 됩니다.
돌파, 재테스트 및 실패한 돌파
초기 범위에서 돌파가 발생한 후, 지표는 가격이 다음에 무엇을 하는지 추적합니다:
- 범위 밖에 머무는 바 수를 계산합니다.
- 가격이 충분히 멀리 이동했는지 확인합니다 (최소 거리 %).
- 그런 다음 범위 내로의 재테스트를 관찰합니다.
다음과 같은 것을 볼 수 있습니다:
- IR60 LONG / IR60 SHORT (돌파)
- Retest LONG / Retest SHORT 라벨은 가격이 확실한 움직임 후에 다시 돌아올 때 표시됩니다
- Failed LONG / Failed SHORT 라벨은 돌파가 빠르게 실패하고 가격이 확실한 의지 없이 범위 내로 다시 진입할 때 표시됩니다.
이것은 세 가지 유형의 정보를 제공합니다:
- 깨끗한 돌파
- 재테스트가 있는 건강한 돌파
- 가짜/실패한 돌파
목표, 손절 및 거래 시각화
지표는 또한 다음을 기반으로 자동 TP 및 SL 레벨을 계산합니다:
- ATR
- IR 폭의 %
- 고정 % 손절
- 스윙 포인트
- “스마트” 적응형 및 스케일된 ATR 모드
진입 가격과 손절 레벨에서 여러 목표를 계산합니다:
- TP1 (1R)
- TP1.5 (1.5R)
- TP2 (2R)
- TP3 (3R)
표시할 목표를 선택할 수 있습니다.
차트에 선이 그려집니다:
- IR_ENTRY_LONG / IR_ENTRY_SHORT
- IR_SL_LONG / IR_SL_SHORT
- IR_TP1 / IR_TP1.5 / IR_TP2 / IR_TP3
가격이 목표나 손절에 도달하면 상태가 업데이트되고, 설정에 따라 마지막 TP 후 또는 하루가 끝날 때 선이 “고정”될 수 있습니다.
요약하자면
- 이전 이름: ORB (Opening Range Breakout)
- 새 이름: IR (Initial Range) – 동일한 개념, 더 깔끔한 명칭
- 초기 세션 범위(IR5, IR15, IR30, IR60)를 생성합니다
- LONG / SHORT 돌파, 재테스트, 그리고 실패한 돌파
- 품질 향상을 위해 추세, 거래량, FVG, 풀백 필터를 사용합니다
- 차트에 진입, 손절 및 여러 목표를 직접 그립니다
그래서 차트에서 “IR60 LONG”을 보면, 기본적으로 세션 첫 60분 동안의 Opening Range Breakout을 보고 있는 것이며, 더 현대적이고 사용자 정의 가능한 이름과 많은 추가 로직이 뒤따릅니다.
요약
The indicator marks breakout signals when price moves above the range high (LONG) or below the range low (SHORT), displaying corresponding labels on the chart. It also tracks retests and failed breakouts, distinguishing clean breakouts, healthy retests, and fake moves.
To improve signal quality, the indicator incorporates multiple filters: trend filters using VWAP and EMA, volume filters comparing current volume to averages, Fair Value Gap (FVG) filters detecting bullish or bearish imbalances near breakout levels, and pullback filters requiring minimum retracements after breakouts.
Additionally, it calculates and plots automatic entry, stop loss, and multiple take profit levels based on ATR, percentage of the initial range width, fixed percentages, swing points, and adaptive ATR modes. These visual aids help traders manage risk and targets directly on the chart.
The Initial Range indicator supports various markets including Forex, stocks, indices, commodities, and cryptocurrencies, and is designed to enhance breakout trading strategies with customizable parameters and comprehensive trade visualization.
고객 리뷰
5 | 100 % | |
4 | 0 % | |
3 | 0 % | |
2 | 0 % | |
1 | 0 % |


