
Descripción
Market Cipher A es un indicador técnico avanzado diseñado para facilitar el análisis, la identificación y la predicción de tendencias macro en el mercado de criptomonedas.
Estructura y Componentes
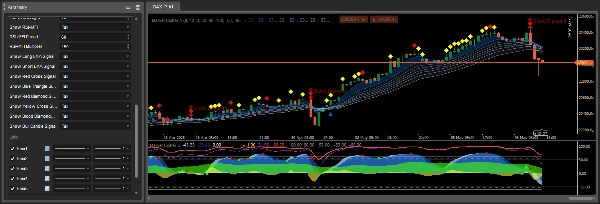
Market Cipher A consta de una cinta de 8 medias móviles exponenciales (EMA) que cambian de color según la tendencia del mercado. La cinta EMA se vuelve azul o blanca durante un mercado alcista y gris durante un mercado bajista.
Por defecto, se utilizan medias móviles con valores EMA de 5 a 34. Los cruces de estas líneas pueden ser indicadores rezagados muy fuertes, por lo que Market Cipher A ha sido programado para mostrar automáticamente símbolos correspondientes a diferentes señales, eliminando la necesidad de interpretar manualmente cada cruce alcista o bajista.
Símbolos y Señales de Trading
Market Cipher A muestra símbolos característicos directamente en el gráfico de velas que indican posibles oportunidades de trading:
Triángulo Azul - señal de reversión de tendencia, indica disminución del impulso y una reversión próxima. Es una advertencia temprana de que el impulso de la tendencia está disminuyendo.
Círculo Verde - indicador alcista, más fiable en marcos temporales de 6 horas o superiores. Normalmente aparece después de un triángulo azul y debe interpretarse dentro de un rango de 1-3 velas.
Diamantes Amarillos - indican la continuación de una tendencia alcista. Deben usarse junto con la cinta EMA para una mejor confirmación de la dirección de la tendencia.
Diamantes Rojos - señalan debilitamiento de la tendencia y posible continuación a la baja. Indican un aumento del impulso bajista.
X Roja - indicador bajista, más efectivo en marcos temporales de 1 hora o superiores. Debe usarse junto con la cinta EMA y el diamante rojo.
X Amarilla - indica manipulación del mercado, particularmente la cobertura de posiciones largas grandes que son rápidamente compradas y vendidas por posiciones cortas.
Diamante Rojo Grande (Diamante de Sangre) - la señal más bajista, que indica alta probabilidad de caída, especialmente cuando ocurre junto con una X roja o un diamante rojo más pequeño.
Principios de Uso
Market Cipher A proporciona soporte o resistencia matemática fuerte de forma visual, facilitando la comprensión del entorno de trading. Funciona mejor con velas Heiken Ashi.
La cinta EMA no solo indica la tendencia sino que también actúa como niveles dinámicos de soporte y resistencia. Cuando la cinta es azul/blanca y las velas están por encima, se pueden buscar oportunidades para tomar posiciones largas. Cuando la cinta es gris y las velas están por debajo, se pueden considerar posiciones cortas.
Los mejores resultados se logran cuando las señales de Market Cipher A se combinan con otros indicadores del paquete Market Cipher, particularmente Market Cipher B, que proporciona señales adicionales de impulso y puntos de entrada.
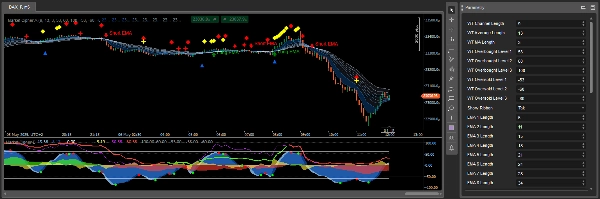
Interpretación Detallada de Señales en el Contexto de la Tendencia
Un aspecto importante de Market Cipher A es la interpretación contextual de las señales según la tendencia dominante. Cuando la cinta cambia de color de gris a azul, el indicador genera un círculo verde como señal del inicio de una tendencia alcista. Normalmente, después de un círculo verde, si las siguientes 1-3 velas muestran un diamante amarillo, la probabilidad de un rompimiento es alta. Sin embargo, si aparecen diamantes rojos, es menos probable el rompimiento.
Durante un mercado alcista, los diamantes amarillos son favorables, mostrando continuación al alza alineada con la tendencia, mientras que los diamantes rojos representan un movimiento en contra de la tendencia. En un mercado bajista, la situación se invierte: los diamantes rojos son favorables como continuación de la caída, y los diamantes amarillos indican un movimiento temporal al alza contrario a la tendencia.
La X roja es más fiable cuando aparece después de un diamante rojo y la cinta EMA está casi completamente contraída, cambiando su color a gris bajista. La precisión de este indicador varía según el marco temporal.
Mecanismo de Operación y Génesis de Señales
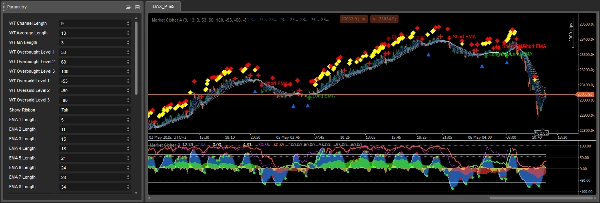
Los símbolos y señales en Market Cipher A se generan basándose en varias fuentes: cruces de ondas WaveTrend, niveles de sobrecompra y sobreventa, y basándose en RSI y MFI cuando cruzan la línea central o alcanzan condiciones de sobrecompra y sobreventa. Este análisis multidimensional hace que las señales sean más completas que los indicadores individuales.
La cinta EMA consta de 8 medias móviles que forman una cinta característica con separación entre bandas individuales. La separación de bandas es un factor importante: una separación amplia indica una tendencia fuerte, mientras que bandas contraídas sugieren debilitamiento del impulso o consolidación.
Aplicación Práctica en Estrategias de Trading
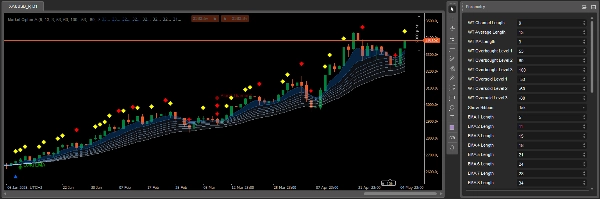
Market Cipher A fue diseñado principalmente como una herramienta de análisis de tendencias, por lo que funciona mejor en estrategias que siguen la tendencia. Se recomienda usar la cinta junto con otros indicadores de identificación de tendencias, y luego buscar oportunidades de trading durante retrocesos de precio.
Es importante recordar que estas señales ayudan a afinar el momento de entrada o salida de las operaciones, pero no deben usarse solas para tomar decisiones de trading. Se necesitan confirmaciones adicionales, especialmente para señales de reversión que ocurren durante movimientos planos del precio.
Resumen
The indicator automatically displays distinct symbols on the price chart to signal potential trading opportunities:
- Blue Triangle: signals declining momentum and possible trend reversal.
- Green Circle: indicates a bullish trend start, most reliable on 6-hour timeframes and above.
- Yellow Diamonds: suggest continuation of an upward trend.
- Red Diamonds: indicate trend weakening and potential downward continuation.
- Red X: bearish signal effective on 1-hour timeframes and higher.
- Yellow X: points to market manipulation events.
- Large Red Diamond ("Blood Diamond"): strong bearish signal with high probability of decline.
Signals are generated using a combination of WaveTrend crossovers, RSI, and MFI indicators, providing multidimensional market analysis. Market Cipher A is optimized for use with Heiken Ashi candles and is best applied within trend-following strategies, ideally combined with other Market Cipher indicators for enhanced entry and momentum confirmation.
Valoraciones de clientes
5 | 67 % | |
4 | 33 % | |
3 | 0 % | |
2 | 0 % | |
1 | 0 % |


