
Descripción
Vitrina:
Market Cipher B es un indicador de análisis técnico potente pero fácil de usar diseñado para ayudarte a tomar decisiones de trading con confianza en los mercados financieros, desde criptomonedas hasta acciones y forex. Ya seas un principiante o un trader experimentado, este oscilador ofrece señales claras de compra y venta, dándote la ventaja que necesitas para navegar mercados volátiles con facilidad.
¿Por qué elegir Market Cipher B?
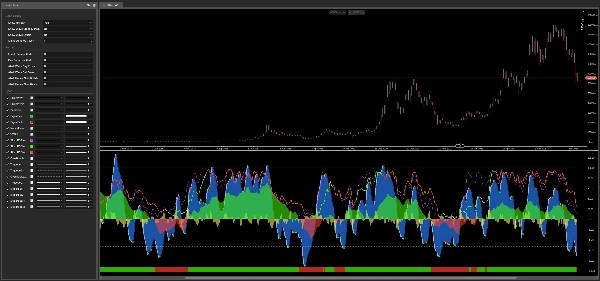
1. Señales claras de compra y venta El indicador señala puntos óptimos de entrada y salida con señales fáciles de leer. Los puntos verdes indican oportunidades de compra, mientras que los puntos rojos señalan cuándo vender. Esto facilita que cualquiera actúe rápida y decisivamente, incluso sin un conocimiento técnico profundo.
2. Ondas azules – El impulso del mercado de un vistazo Market Cipher B utiliza dos líneas dinámicas de ondas azules que revelan si el mercado está ganando fuerza o perdiendo impulso. Sus cruces destacan momentos clave para captar tendencias emergentes o evitar pérdidas potenciales. El sistema de ondas forma el motor principal del indicador, proporcionando una base confiable para todas las demás señales.
3. Diferencial del impulso de las ondas – Tu brújula direccional La línea amarilla representa la diferencia entre las dos ondas azules, actuando como un medidor de impulso en tiempo real. Cuando sube por encima de cero, los compradores tienen el control; cuando cae por debajo, dominan los vendedores. Esto te ayuda a determinar instantáneamente si una tendencia tiene fuerza detrás o está cerca de agotarse y revertirse.
4. Flujo de dinero – Sigue a dónde va el dinero La línea de Flujo de Dinero verde y roja revela hacia dónde están dirigiendo su capital los inversores. Calculada como un oscilador suavizado durante 60 períodos, muestra cuándo jugadores institucionales o a gran escala están entrando o saliendo del mercado. Los cruces por encima y por debajo de la línea cero son especialmente significativos, a menudo precediendo movimientos importantes de precio y dándote una ventaja significativa.
5. Barra MFI – Señal instantánea del flujo de capital Una barra codificada por colores mostrada en la parte inferior del panel del indicador proporciona una visualización rápida de la dirección actual del Flujo de Dinero. Una barra verde señala dominio alcista del capital, mientras que una barra roja indica presión bajista. Las transiciones de color en la barra resaltan posibles reversos de tendencia de inmediato, sin necesidad de análisis numérico, siendo una de las señales visuales más rápidas disponibles en el indicador.
6. RSI Estocástico – Temporización precisa Una línea morada de RSI Estocástico, junto con líneas RSI más lentas verde y roja, te ayuda a identificar condiciones de mercado sobrecompradas (potencialmente sobrevaloradas) o sobrevendidas (potencialmente infravaloradas) con alta precisión. El diseño de doble velocidad – una línea rápida (40 períodos) y una lenta (81 períodos) – te permite distinguir entre ruido a corto plazo y cambios genuinos de impulso, ideal para encontrar puntos de reversión de alta probabilidad y evitar trampas comunes del mercado.
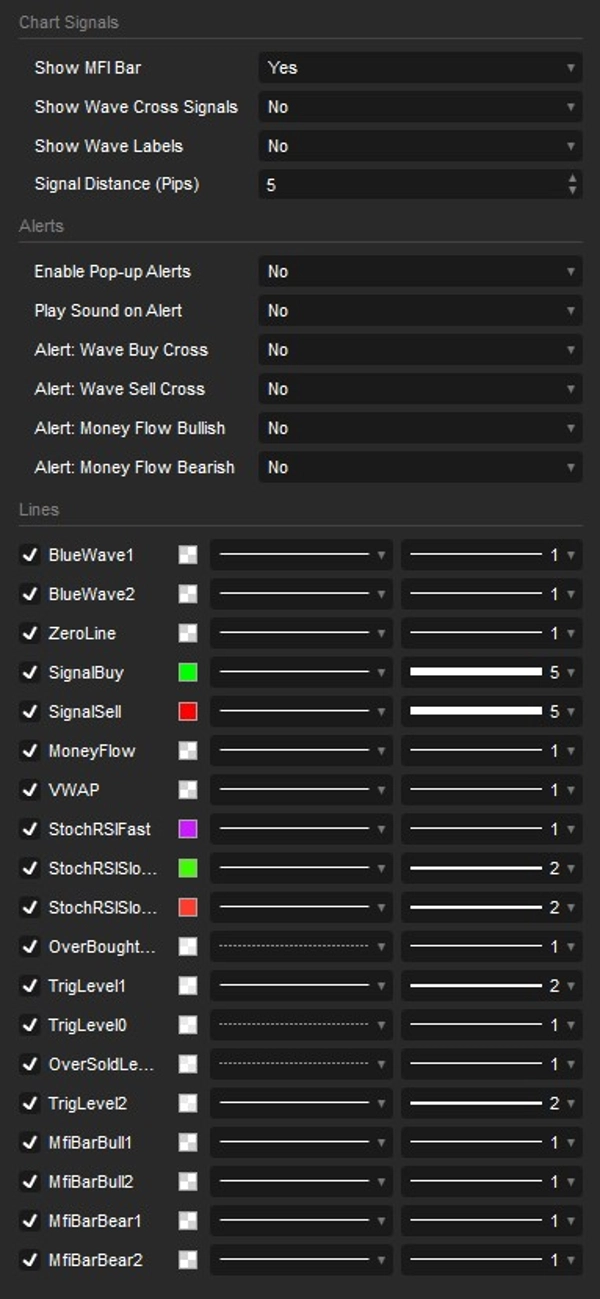
7. Sistema de alertas inteligente – Nunca pierdas una señal Market Cipher B incluye un sistema de notificaciones totalmente configurable que te mantiene informado incluso cuando estás lejos de la pantalla. Puedes activar o desactivar independientemente las alertas emergentes y las notificaciones sonoras para cuatro eventos clave: Cruce de compra de onda, cruce de venta de onda, Flujo de Dinero cruzando por encima de cero (alcista) y Flujo de Dinero cruzando por debajo de cero (bajista). Cada tipo de alerta puede activarse por separado, dándote control total sobre lo que más importa para tu estrategia de trading.
8. Flexibilidad y personalización Market Cipher B funciona perfectamente en cualquier mercado y marco temporal disponible en cTrader – desde gráficos de scalping de un minuto hasta vistas semanales de swing trading. Tienes control total sobre qué componentes se muestran, incluyendo la Barra MFI, señales de cruce de ondas, etiquetas de señal (texto Comprar/Vender directamente en el gráfico de precios) y todos los tipos de alertas. Esta modularidad significa que puedes adaptar el indicador para que coincida exactamente con tu estilo de trading sin desorden visual.
¿Para quién es Market Cipher B?
Nuevos traders apreciarán las señales intuitivas de compra/venta, los visuales codificados por colores y los niveles de referencia claros que facilitan comenzar a operar sin requerir años de experiencia en análisis técnico. El indicador comunica sus conclusiones visualmente, para que pases menos tiempo leyendo números y más tiempo actuando sobre oportunidades.
Inversores experimentados encontrarán valor en los componentes avanzados – Flujo de Dinero, Diferencial del Impulso de las Ondas y el RSI Estocástico dual – que juntos proporcionan una vista multinivel de la estructura del mercado adecuada para estrategias sofisticadas y de alta convicción.
Traders de día y swing se benefician de la flexibilidad del marco temporal del indicador y la rápida generación de señales, permitiéndoles capitalizar tanto movimientos intradía rápidos como tendencias direccionales a más largo plazo sin cambiar entre múltiples herramientas.
Resumen
Additional components include a Money Flow line that tracks capital movement by large investors, accompanied by a color-coded Money Flow bar for quick visual cues on market pressure. A dual-speed Stochastic RSI helps identify overbought and oversold conditions, aiding in precise timing for potential reversals.
Market Cipher B supports full customization, allowing users to enable or disable specific features and alerts for key events such as wave crosses and Money Flow shifts. It operates on any timeframe, from minute charts to weekly views, making it suitable for new traders, experienced investors, day traders, and swing traders. The indicator integrates multiple analytical tools into one interface, aiming to provide a comprehensive market overview and assist in making informed trading decisions.
Valoraciones de clientes
5 | 67 % | |
4 | 33 % | |
3 | 0 % | |
2 | 0 % | |
1 | 0 % |


