
Frac Support Resistance V1
Indicador
2 compras
Versión 1.0, Nov 2025
Windows, Mac
5.0
Valoraciones: 1
Descripción
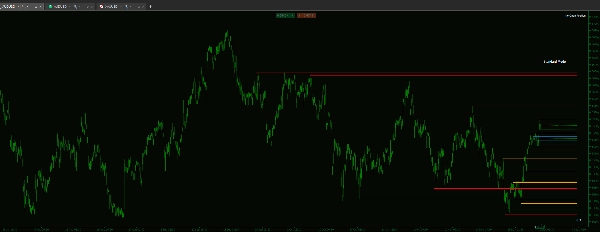
Si operas basándote en la estructura del mercado, sabes que los niveles más críticos a menudo se establecen en un marco temporal superior. Este indicador personalizado resuelve la frustración de identificar y seguir manualmente esos niveles.
Esta herramienta está diseñada para proporcionar una jerarquía visual confiable, asegurando que puedas ver los límites estructurales críticos y priorizar zonas de alto valor sin salir de tu pantalla de ejecución.
Características clave y control granular
- El indicador está construido para un rendimiento excepcional y una visualización limpia del gráfico:
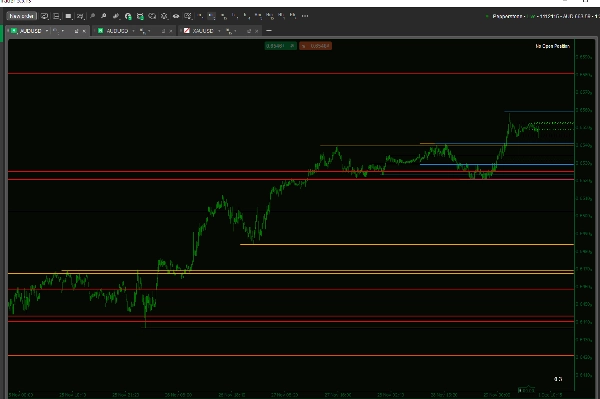
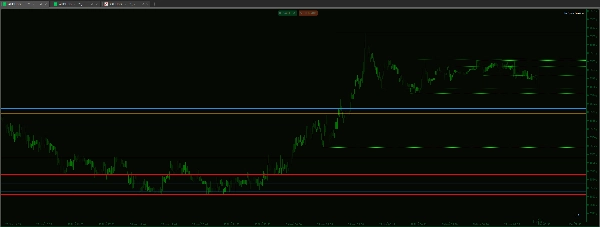
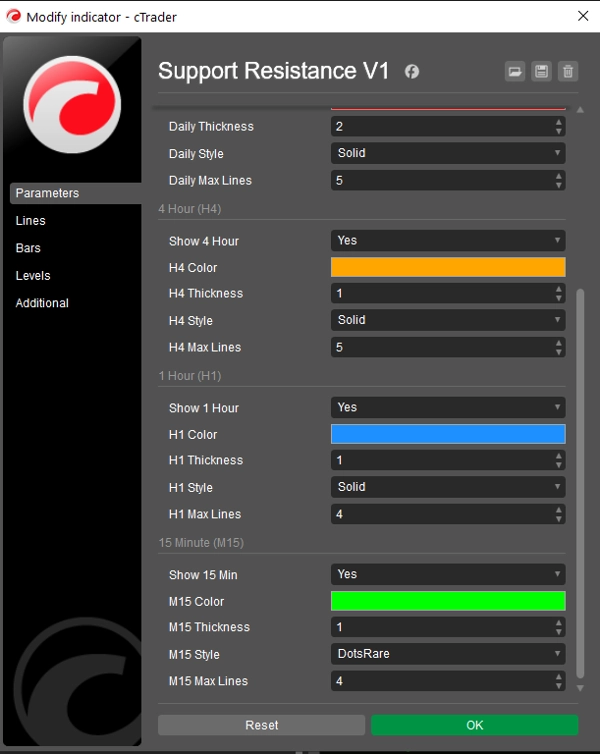
- Jerarquía visual verdadera: Obtén control independiente sobre el grosor, el estilo de línea (Sólido, Guion, Punto) y el color para cada marco temporal.
- Beneficio: Reconoce inmediatamente la fuerza de un nivel solo por su apariencia (por ejemplo, configura las líneas D1 para que sean Gruesas/Sólidas para la estructura principal y las líneas H1 para que sean Finas/Punteadas para niveles inmediatos).
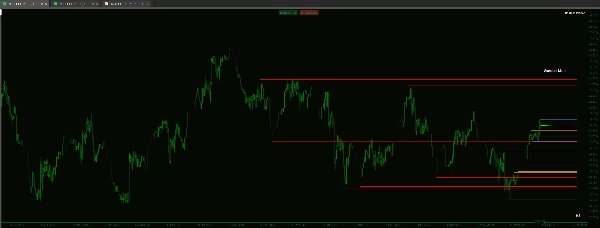
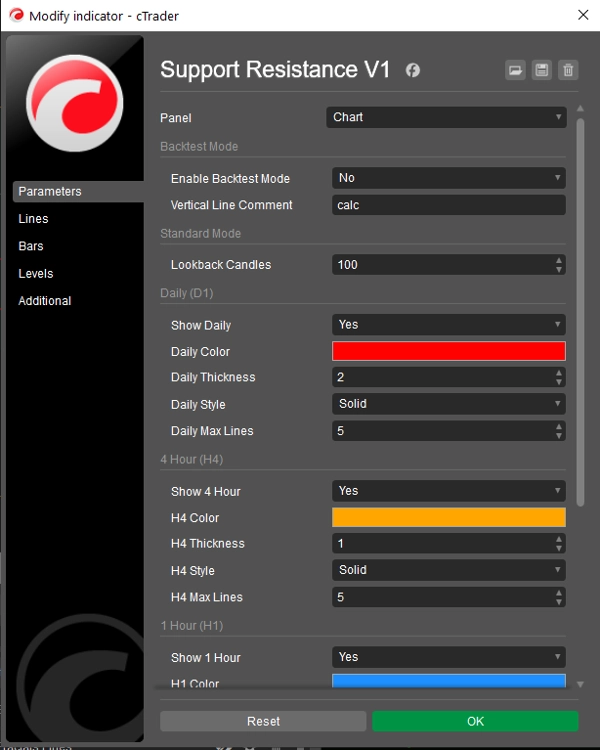
- Control de rendimiento y enfoque: ¿Cansado de gráficos saturados? Puedes limitar el número máximo de líneas mostradas para cada marco temporal individualmente.
- Ejemplo: Configura el máximo de líneas H4 a 5 y el máximo de líneas D1 a 15 para priorizar niveles recientes en marcos temporales inferiores mientras mantienes una vista más profunda de las estructuras principales.
- Base de código limpia: Construido sobre lógica fractal confiable, asegurando que los niveles identificados sean pivotes altos/bajos genuinos usados en el análisis estructural estándar.
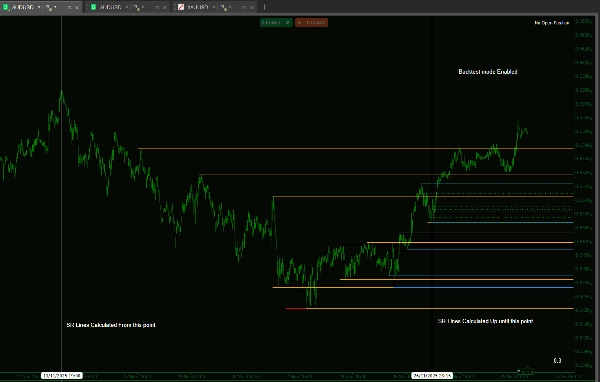
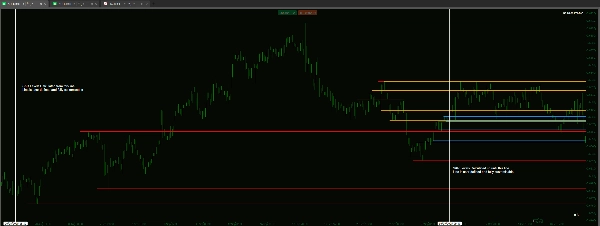
- Modo dedicado de backtesting: Incluye una función para restringir el análisis del indicador a un rango de tiempo específico y definido en el gráfico. Esto es esencial para un backtesting manual preciso simulando la progresión del tiempo sin sesgo futuro.
Resumen
Resumen de IA
Frac Support Resistance V1 is a technical indicator designed to automatically calculate and display smart support and resistance lines derived from multiple timeframes: daily (D1), 4-hour (H4), hourly (H1), and 15-minute (M15). It assists traders who rely on market structure by visually highlighting critical price levels established on higher timeframes, reducing the need for manual identification.
Key features include customizable visual hierarchy, allowing independent adjustment of line thickness, style (solid, dashed, dotted), and color for each timeframe. This enables quick recognition of the relative strength of support and resistance levels. Users can also control chart clarity by setting maximum numbers of lines per timeframe to prioritize recent or major structural levels.
The indicator is based on fractal logic to identify genuine high and low pivots consistent with standard market structure analysis. It includes a dedicated backtesting mode that restricts analysis to a specified historical period, facilitating unbiased manual strategy testing by simulating real-time progression.
Frac Support Resistance V1 supports various markets including Forex, cryptocurrencies, commodities, indices, and stocks, with tags indicating compatibility with symbols like BTCUSD, EURUSD, GBPUSD, XAUUSD, NAS100, and USDJPY. The tool is suited for strategies involving breakout, scalping, smart money concepts, and grid trading.
Perfil del indicador
Valoraciones de clientes
5.0
Valoraciones: 1
5 | 100 % | |
4 | 0 % | |
3 | 0 % | |
2 | 0 % | |
1 | 0 % |
Valoraciones de clientes
December 1, 2025
A small account test feels safer, and the plan becomes easier to stick with, and the chart still needs a final look.
Conversación
Preguntas frecuentes
BTCUSD
Forex
Signal
Breakout
Indices
EURUSD
Commodities
GBPUSD
NZDUSD
Prop
Scalping
SMC
Crypto
Grid
Stocks
AI
XAUUSD
NAS100
USDJPY
Los productos disponibles a través de cTrader Store, incluidos bots, indicadores y plugins para operar, son proporcionados por desarrolladores de terceros y están disponibles únicamente con fines informativos y de acceso técnico. cTrader Store no es un bróker, por lo que no proporciona asesoramiento de inversión, recomendaciones personales ni ninguna garantía de rentabilidad futura.


Precio
Desde 14/01/2025
55
Ventas
11.5K
Instalaciones gratis