

Mô tả
🏆 Hơn 10.000 Nhà giao dịch Tin tưởng Bộ công cụ Thuật toán 25+ của chúng tôi! 🏆
Từ Cấu trúc Thị trường & Thanh khoản đến Hệ thống Thoát Thông minh & Công cụ Dự đoán - chúng tôi đã xây dựng MỌI công cụ bạn cần để có sự nhất quán.
👉 Truy cập Tất cả 25+ Hệ thống ĐÃ KIỂM CHỨNG:
_______________________________________________
📌 Chỉ báo Cấu trúc Thị trường
· 🔄 Phân tích Cấu trúc Thị trường Động về các Điểm Quay
· 🧱 Order Block
· ⛓️ BOS & CHOCH
· 🧠 ICT Power of 3
_______________________________________________
🔚 Hệ thống Thoát Thông minh
· 📍 Thuật toán Thông minh Theo sau
_______________________________________________
📐 Chỉ báo ZigZag
· 🔍 Dự báo Thanh khoản Giá ZigZag
· ➖ ZigZag
· 🎯 Bộ theo dõi Cực điểm Zig-Zag
_______________________________________________
🧱 Chỉ báo Hỗ trợ & Kháng cự
· 🟩 Đường Hỗ trợ & Kháng cự SmartTrend
· 🧱 Tất cả các Mức Hỗ trợ và Kháng cự
_______________________________________________
📊 Chỉ báo Xu hướng & Kênh
· 📊 Supertrend
· ⚡Bộ phân tích Xu hướng Động lượng
· ⭐ KÊNH SSL CAO CẤP
_______________________________________________
💧 Công cụ Khối lượng & Thanh khoản
· 🔥 Bản đồ Nhiệt POC Khối lượng
· 🔍 Khoảng cách Giá Trị Công bằng Động lượng
· 🕒 Phiên Khoảng cách Giá Trị Công bằng
_______________________________________________
⚡ Chỉ báo Động lượng & RSI
· 🔎 Bộ theo dõi Định hướng Nến Đa cấp
Tracker
_______________________________________________
🔮 Công cụ Dự đoán & Dự báo
· 📐 Dự đoán dựa trên Linreg& ATR
· 📏 Hồi quy Tuyến tính Fibonacci Đa khung thời gian
· 📈 Máy chiếu Dòng chảy Thị trường dựa trên Khối lượng_________________________
_________________________________________________________________________________________________
_________________________________________________________________________________________________
ZigZag Structure Pro – 🚀
Tự động xác định các điểm quay quan trọng của thị trường (đỉnh và đáy chính) và vẽ các vùng hỗ trợ và kháng cự động cập nhật theo thời gian thực. 🎯 Khác với các mức tĩnh truyền thống, chỉ báo này liên tục thích ứng với cấu trúc giá thay đổi.
Nó dùng để làm gì? ❓
Chỉ báo này là một công cụ phân tích kỹ thuật chuyên nghiệp được thiết kế để:
- Xác định các mức độ tổ chức: 🏛️ Tự động phát hiện các điểm mà giá đã hình thành các cấu trúc đỉnh và đáy quan trọng.
- Phân tích cấu trúc thị trường: 📊 Phân loại mỗi chuyển động theo phương pháp cấu trúc tăng/giảm (Đỉnh cao hơn, Đáy thấp hơn, v.v.).
- Dự báo xu hướng: 🔮 Kéo dài các đường xu hướng vào tương lai để dự đoán các vùng phản ứng giá tiềm năng.
- Giao dịch đảo chiều và tiếp diễn: 💰 Các mức được đánh dấu làm tham chiếu cho điểm vào, dừng lỗ và mục tiêu lợi nhuận.
Chỉ báo vẽ trên biểu đồ của bạn: ✍️
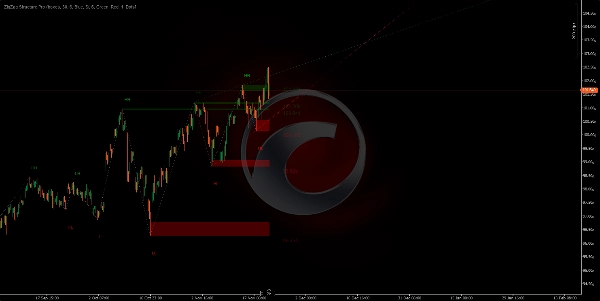
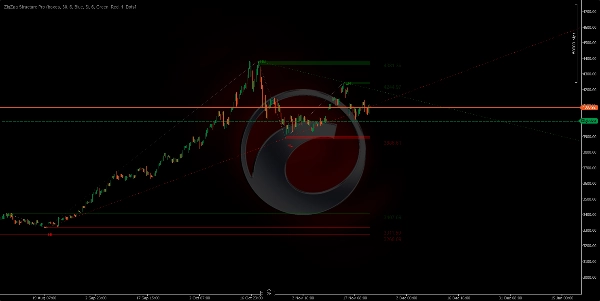
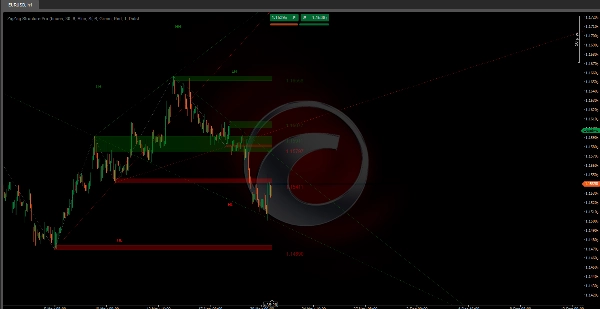
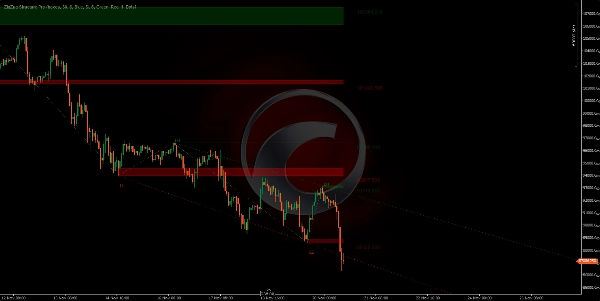
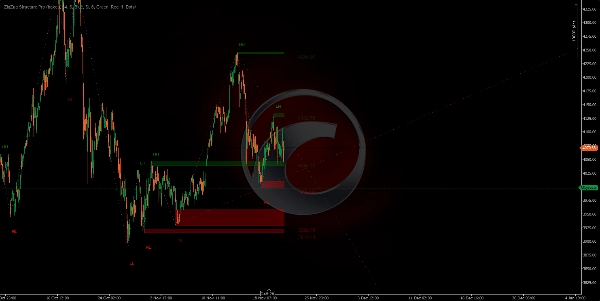
1. Vùng Hỗ trợ/Kháng cự (Hình chữ nhật)
- Vùng màu xanh lá: 🟢 Đánh dấu các khu vực hỗ trợ (đáy quan trọng nơi giá có thể bật lên).
- Vùng màu đỏ: 🔴 Đánh dấu các khu vực kháng cự (đỉnh quan trọng nơi giá có thể điều chỉnh giảm).
- Các vùng này được chiếu về phía trước, hiển thị các mức đang hoạt động hiện tại.
- Độ dày của mỗi vùng đại diện cho thân nến nơi pivot được hình thành.
https://chartshots.spotware.com/c/691f5a4d75ac4
https://chartshots.spotware.com/c/691f6b4f2e98b
https://chartshots.spotware.com/c/691f6c6fda808
https://chartshots.spotware.com/c/691f6d0aa6155
2. Đường Kết nối ⚡
- Kết nối mỗi pivot với pivot tiếp theo, tạo thành một mẫu "zigzag" trực quan.
- Loại bỏ nhiễu thị trường, chỉ hiển thị các chuyển động thực sự quan trọng.
- Giúp dễ dàng nhìn thấy hướng đi và cấu trúc của xu hướng ngay lập tức.
3. Đường Xu hướng Dự báo (Màu xanh lá/Đỏ mở rộng)
- Vẽ từ pivot trước đến pivot hiện tại và kéo dài về phía tương lai.
- Màu xanh lá: 🟢 Đường xu hướng tăng (từ đáy).
- Màu đỏ: 🔴 Đường xu hướng giảm (từ đỉnh).
- Hiển thị 2 đường xu hướng gần đây và đang hoạt động nhất.
- Hữu ích để phát hiện phá vỡ hoặc tôn trọng xu hướng.
4. Nhãn Cấu trúc Thị trường 🏷️
Mỗi pivot hiển thị một nhãn cho biết phân loại của nó:
- HH (Đỉnh cao hơn): ↗️ Đỉnh cao hơn - Tiếp diễn xu hướng tăng.
- LH (Đỉnh thấp hơn): ⬆️ Đỉnh thấp hơn - Có thể đảo chiều giảm.
- HL (Đáy cao hơn): ⬇️ Đáy cao hơn - Có thể đảo chiều tăng.
- LL (Đáy thấp hơn): ↘️ Đáy thấp hơn - Tiếp diễn xu hướng giảm.
Logic đằng sau thuật toán 🧠
Chỉ báo sử dụng thuật toán zigzag thích ứng mà:
- Quét giá để tìm các đỉnh và đáy trong một khoảng thời gian có thể cấu hình (mặc định 34 thanh).
- Lọc các chuyển động không đáng kể qua ngưỡng sai lệch tối thiểu (mặc định 6 pip).
- Xác thực mỗi pivot đảm bảo nó đại diện cho sự thay đổi thực sự trong cấu trúc thị trường.
- So sánh cấu trúc giữa các pivot liên tiếp để phân loại loại chuyển động.
- Cập nhật động các vùng khi các pivot mới xuất hiện, loại bỏ các pivot cũ nhất.
Cài đặt chính ⚙️
- Số thanh nhìn lại Pivot: Điều khiển độ nhạy của bộ phát hiện pivot (thấp hơn = nhiều pivot hơn, cao hơn = chỉ các pivot chính).
- Bộ lọc Sai lệch Giá: Bộ lọc nhiễu - các chuyển động nhỏ hơn giá trị này sẽ bị bỏ qua.
- Số vùng hiển thị tối đa: Số mức lịch sử vẫn hiển thị (từ 1 đến 20).
- Loại hiển thị vùng: Chọn giữa hình chữ nhật (vùng đầy đủ) hoặc đường đơn giản.
- Hiển thị Đường xu hướng Mở rộng: Bật/tắt dự báo xu hướng.
Hướng dẫn nhanh về tham số 📖
Số thanh nhìn lại Pivot (Mặc định: 30)
- ↑ Tăng (40-100): ÍT pivot hơn, quan trọng hơn. Dành cho giao dịch swing.
- ↓ Giảm (15-25): NHIỀU pivot hơn, nhiều tín hiệu hơn. Dành cho giao dịch lướt sóng/ngày.
Bộ lọc Sai lệch Giá (Mặc định: 6)
- ↑ Tăng (8-15): Lọc nhiễu, chỉ các chuyển động lớn. Ít tín hiệu hơn, chất lượng cao hơn.
- ↓ Giảm (2-5): Nhạy hơn, bắt được các chuyển động nhỏ. Nhiều tín hiệu hơn.
Số vùng hiển thị tối đa (Mặc định: 6)
- ↑ Tăng (10-20): Nhiều mức lịch sử hiển thị hơn. Dành cho phân tích sâu.
- ↓ Giảm (2-4): Chỉ các mức gần đây. Biểu đồ sạch hơn.
Giới hạn Pivot Lịch sử (Mặc định: 200)
- ↑ Tăng (300-500): Nhiều lịch sử hơn cho các phép tính. Phân tích dài hạn.
- ↓ Giảm (50-150): Chỉ cấu trúc gần đây. Hiệu suất tốt hơn.
Số lượng Dự báo Hoạt động (Mặc định: 5)
- ↑ Tăng (5-10): Nhiều đường xu hướng dự báo hơn.
- ↓ Giảm (1-2): Chỉ các xu hướng chi phối. Rõ ràng hơn.
Hiển thị Đường xu hướng Mở rộng (Có/Không)
- Bật: Dự báo xu hướng vào tương lai.
- Tắt: Chỉ zigzag lịch sử.
🎯 Cài đặt Nhanh
- Giao dịch lướt sóng: Lookback 15-20 | Sai lệch 3-5 | Vùng 3-4
- Giao dịch trong ngày: Lookback 25-35 | Sai lệch 6-8 | Vùng 5-6
- Giao dịch swing: Lookback 40-60 | Sai lệch 10-15 | Vùng 8-12
Tóm tắt
Key features include:
- Support and resistance zones displayed as rectangles, with green zones marking support (significant lows) and red zones marking resistance (significant highs). These zones are projected forward to show current active levels.
- Connection lines linking pivots to form a clear zigzag pattern, illustrating trend direction and structure.
- Projected trend lines extended into the future, color-coded green for bullish trends and red for bearish trends, highlighting recent active trends and potential breakout or respect points.
- Configurable settings such as pivot lookback period, price deviation filter to reduce noise, maximum visible zones, and option to enable or disable extended trendline projections.
This indicator supports analysis across various markets including Forex, stocks, commodities, indices, and cryptocurrencies. It is suitable for different trading styles, from scalping and day trading to swing trading, by adjusting sensitivity parameters accordingly.
Đánh giá của khách hàng
5 | 25 % | |
4 | 75 % | |
3 | 0 % | |
2 | 0 % | |
1 | 0 % |





























