

Description
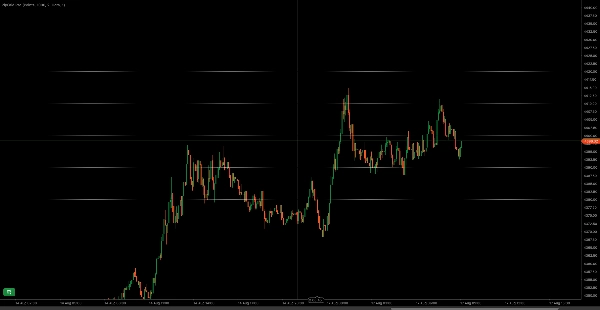
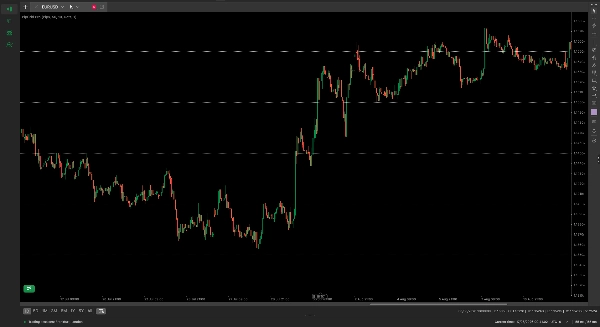
PipGrid Pro automatically plots clean, non-intrusive horizontal price levels calibrated to your exact trading strategy without cluttering your charts.
Institutional order flow, stop placements, and take-profit targets consistently cluster around psychological whole numbers and big figures. While generic scripts break when switching between instruments, often drawing lines thousands of pips away on Gold or Crypto, PipGrid Pro natively reads broker tick and pip specifications to deliver mathematically accurate level spacing on any symbol.
Key Features
- Universal Symbol Calibration: Toggle effortlessly between Pips, Broker Points, and Price Units for accurate scaling on Forex, Metals (XAUUSD), Indices, and Cryptocurrencies.
- Safe Object Namespace: Draws exclusively under the isolated RNL_ identifier. It will never overwrite, modify, or delete your manual chart drawings, Fibonacci retracements, or third-party indicators.
- Dynamic Range Tracking: Automatically re-centers and updates the visible grid window as market price moves.
- Full Visual Customization: Adjust line colors, styles (Solid, Dots, Lines, LinesDots), and thickness to match any dark or light chart theme.
- Lightweight Execution: Zero performance lag; calculations execute strictly on live bar boundary checks.
Parameter Settings
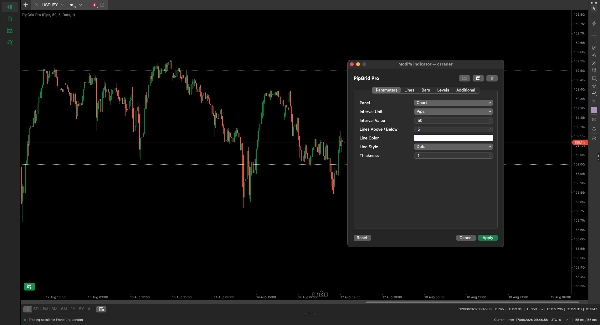
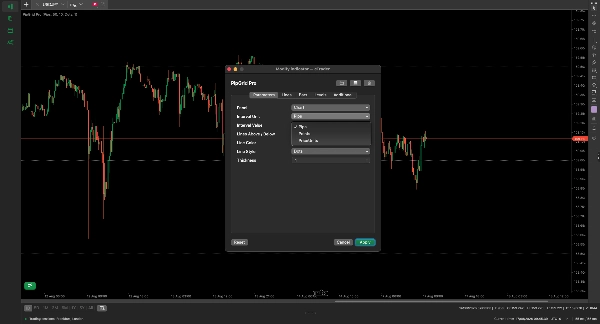
- Interval Unit (Default: Pips) — Select your calculation mode between Pips, Points, or Price Units for exact asset calibration.
- Interval Value (Default: 10.0) — The exact step distance between each horizontal grid line.
- Lines Above / Below (Default: 20) — The total number of grid levels plotted above and below the current market price.
- Line Color (Default: Gray) — Visual color of the plotted grid lines.
- Line Style (Default: Dots) — Visual pattern for the lines (Solid, Dots, Lines, LinesDots).
- Thickness (Default: 1) — Stroke thickness of the horizontal lines (values from 1 to 5).
Recommended Asset Configurations
- Forex (EURUSD, GBPUSD): Set Unit to Pips with an Interval of 50 or 100 for institutional whole figures.
- Gold (XAUUSD): Set Unit to Pips with an Interval of 10 or 50 for clean $1.00 and $5.00 price handles.
- Indices (US30, NAS100): Set Unit to Points with an Interval of 100 or 500 for key index milestone levels.
- Crypto (BTCUSD, ETHUSD): Set Unit to PriceUnits with an Interval of 1000 or 5000 for major psychological barriers.
Summary
AI summary
PipGrid Pro is a technical indicator designed to plot horizontal price levels aligned with psychological round numbers across multiple markets including Forex, Gold (XAUUSD), Indices, and Cryptocurrencies. It automatically calibrates grid spacing by reading broker-specific tick and pip values, ensuring accurate and mathematically consistent level placement on any symbol. The indicator supports toggling between pips, broker points, and price units for precise scaling.
Key functionalities include dynamic range tracking that recenters the grid as price moves, a safe object namespace that prevents interference with manual drawings or other indicators, and full visual customization options for line color, style, and thickness. PipGrid Pro operates efficiently with zero performance lag by executing calculations only on live bar boundaries.
Users can configure parameters such as interval unit and value, number of lines above and below the current price, and visual styles. Recommended settings are provided for different asset classes to highlight institutional order flow clusters and key support/resistance levels. This tool is intended for traders seeking clean, non-intrusive visualization of key price levels that reflect market psychology and institutional activity.
Key functionalities include dynamic range tracking that recenters the grid as price moves, a safe object namespace that prevents interference with manual drawings or other indicators, and full visual customization options for line color, style, and thickness. PipGrid Pro operates efficiently with zero performance lag by executing calculations only on live bar boundaries.
Users can configure parameters such as interval unit and value, number of lines above and below the current price, and visual styles. Recommended settings are provided for different asset classes to highlight institutional order flow clusters and key support/resistance levels. This tool is intended for traders seeking clean, non-intrusive visualization of key price levels that reflect market psychology and institutional activity.
Indicator profile
Indicator category
Support & resistance
Output type
Visualisation
Data requirements
Bars only
Tick data
Customer reviews
0.0
Reviews: 0
Customer reviews
No reviews for this product yet. Already tried it? Be the first to tell others!
Discussion
FAQ
Key Levels
Support & Resistance
Products available through cTrader Store, including trading bots, indicators and plugins, are provided by third-party developers and made available for informational and technical access purposes only. cTrader Store is not a broker and does not provide investment advice, personal recommendations or any guarantee of future performance.
More from this author



















Price
Since 10/12/2024
1
Sales