
คำอธิบาย
🚀 เทรดเดอร์กว่า 10,000 คนใช้ อินดิเคเตอร์ ชั้นนำของเรา 🏆
ค้นพบเหตุผลที่มืออาชีพเลือกเรา – เครื่องมือที่ทรงพลังที่สุดบน cTrader (อินดิเคเตอร์, อัลกอริทึม และ cBots) รอคุณอยู่
👉 รับระบบชั้นนำทั้งหมดของเราที่นี่:
_______________________________________________
📌 อินดิเคเตอร์โครงสร้างตลาด
· ✅ AdvancedMarket Structure: Bos, Choch, SwinLevels, Order Blocks, Market Structure& Liquidity Finder
· 🔄 Dynamic Market StructureAnalysis of Turning Points
· 🧱 Order Block
· ⚖️ Market Imbalance
· ⛓️ BOS & CHOCH
· 🧠 ICT Power of 3
_______________________________________________
🔚 ระบบออกอย่างชาญฉลาด
_______________________________________________
📐 อินดิเคเตอร์ ZigZag
· 🔍 ZigZag Price LiquidityProjection
· ➖ ZigZag
_______________________________________________
🧱 อินดิเคเตอร์แนวรับและแนวต้าน
· 🟩 SmartTrend Support &Resistance Lines
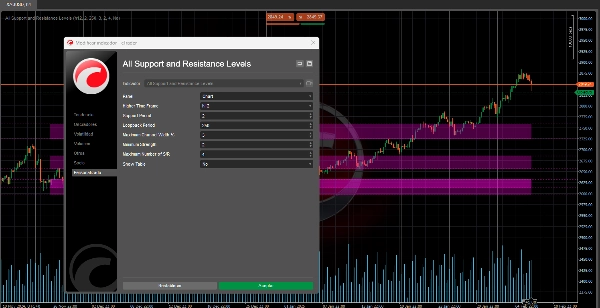
· 🧱 All Support and ResistanceLevels
_______________________________________________
📊 อินดิเคเตอร์แนวโน้มและช่องทาง
· 📊 Supertrend
_______________________________________________
💧 เครื่องมือปริมาณและสภาพคล่อง
_______________________________________________
⚡ อินดิเคเตอร์โมเมนตัมและ RSI
· 🔎 Multi-Level Candle Bias
Tracker
_______________________________________________
🔮 เครื่องมือทำนายและคาดการณ์
· 📐 Prediction Based on Linreg& ATR
· 📏 Fibonacci Linear RegressionMulti-timeframe
· 📈 Volume-Powered Market Flow Projector
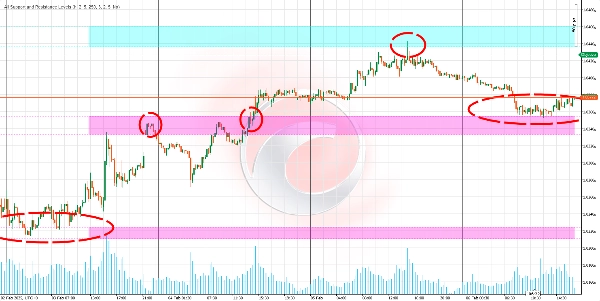
อัลกอริทึมนี้เป็นอินดิเคเตอร์แนวรับและแนวต้านขั้นสูงที่ออกแบบมาเพื่อช่วยคุณระบุระดับสำคัญในตลาด
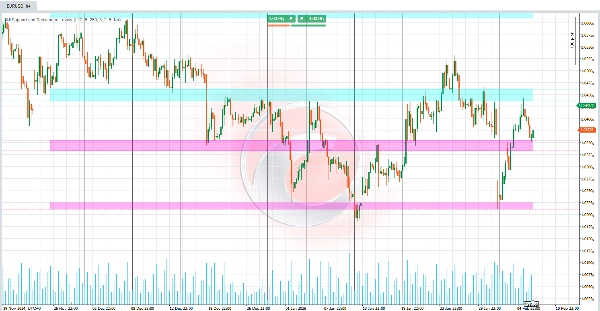
ข้อได้เปรียบหลักของมันคือช่วยให้คุณดูระดับแนวรับและแนวต้านจากกรอบเวลาต่างๆ (เช่น รายวัน รายสัปดาห์ หรือรายเดือน) บนชาร์ตที่คุณกำลังวิเคราะห์ได้โดยตรง แม้ว่าจะเป็นกรอบเวลาอื่น (เช่น 15 นาที หรือ 1 ชั่วโมง) 📊⏰
ใช้ทำอะไร? 🎯
ระบุโซนตลาดสำคัญ:
- ตรวจจับระดับที่ราคาน่าจะหยุด เด้ง หรือทะลุด้วยแรง 💥 🛑↗️↘️
- ช่วยให้คุณตัดสินใจเข้าออกและตั้งจุดหยุดขาดทุนได้อย่างมีข้อมูลมากขึ้น 💡📈📉
วิเคราะห์หลายกรอบเวลาโดยไม่ต้องเปลี่ยนชาร์ต:
- ดูระดับสำคัญจากกรอบเวลาที่สูงกว่า (เช่น รายวัน หรือรายสัปดาห์) ขณะเทรดในกรอบเวลาที่ต่ำกว่า (เช่น 15 นาที หรือ 1 ชั่วโมง) 🕒📅
- ช่วยให้คุณเห็นภาพรวมตลาดกว้างขึ้นโดยไม่ต้องเปลี่ยนชาร์ตบ่อยๆ 🌍🔍
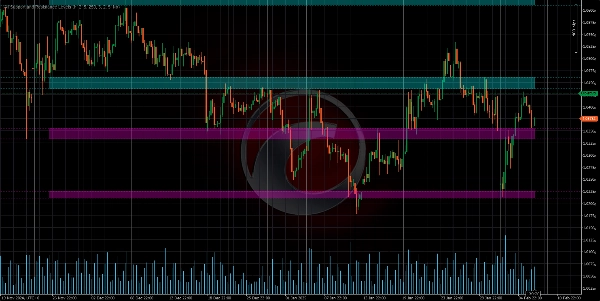
จัดลำดับความสำคัญของระดับที่สำคัญ:
- อินดิเคเตอร์จะจัดอันดับระดับแนวรับและแนวต้านตาม "ความแข็งแกร่ง" หมายถึงจำนวนครั้งที่ราคามีปฏิสัมพันธ์กับระดับนั้นในอดีต 💪📊
- ช่วยให้คุณโฟกัสกับระดับที่เกี่ยวข้องและน่าเชื่อถือที่สุด 🎯✅
ตรรกะทำงานอย่างไร? 🧠⚙️
การเก็บข้อมูล:
- อินดิเคเตอร์จะนำราคาสูงสุดและต่ำสุดจากกรอบเวลาที่กำหนด (รายวัน รายสัปดาห์ ฯลฯ) 📈📉
- ข้อมูลนี้ใช้ค้นหารูปแบบสำคัญในพฤติกรรมราคา 🔍📊
การตรวจจับจุดสำคัญ (พีวอต):
- ระบุจุดสูงและต่ำในท้องถิ่น—จุดที่ราคาถึงจุดสูงสุดหรือต่ำสุดเมื่อเทียบกับราคารอบข้าง ⛰️🌄
- จุดเหล่านี้เป็นผู้สมัครที่จะกลายเป็นระดับแนวรับหรือแนวต้าน 🎯📌
การจัดกลุ่มระดับ:
- ระดับที่ใกล้เคียงกันจะถูกรวมกลุ่มเป็นโซนแนวรับหรือแนวต้าน แทนที่จะเป็นเส้นที่แม่นยำ 🟦🟧
- สะท้อนแนวคิดว่าแนวรับและแนวต้านเป็นพื้นที่ ไม่ใช่จุดที่แม่นยำ 📏🎯
การคำนวณความแข็งแกร่งของระดับ:
"ความแข็งแกร่ง" ของระดับถูกกำหนดโดยสองปัจจัย:
- ความถี่ของการสัมผัส: จำนวนครั้งที่ราคาสัมผัสหรือเข้าใกล้ระดับนั้นในอดีต 🔄📊
- การรวมกลุ่มของจุดสำคัญ: จำนวนจุดสูงหรือต่ำที่อยู่ใกล้ระดับนั้น 🔗📈
ระดับที่มีความแข็งแกร่งมากกว่าจะถือว่าสำคัญกว่า 💪🎯
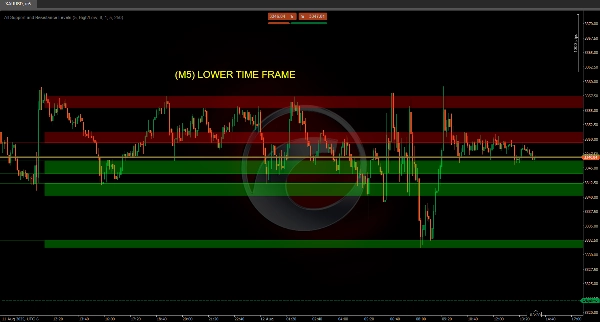
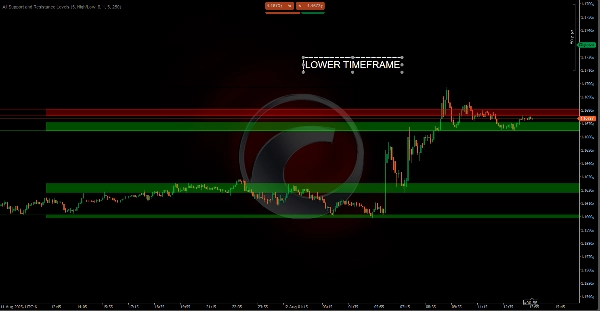
การแสดงผลบนชาร์ต:
- ระดับจะแสดงเป็นเส้นแนวนอนหรือโซนสีบนชาร์ต 🎨📊
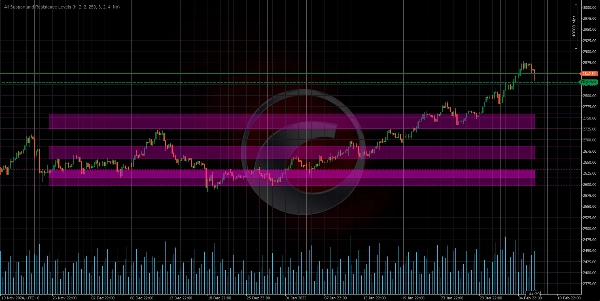
- สีของแต่ละระดับขึ้นอยู่กับตำแหน่งราคาปัจจุบัน:
-
- แนวต้าน: หากราคาต่ำกว่าระดับ 🔴
- แนวรับ: หากราคาสูงกว่าระดับ 🟢
- ภายในช่วง: หากราคาอยู่ภายในช่วงของระดับนั้น 🟡
คุณจะดูกรอบเวลาแตกต่างกันบนชาร์ตของคุณได้อย่างไร? 🕒📊
แนวรับและแนวต้านจากกรอบเวลาที่สูงกว่าบนชาร์ตกรอบเวลาที่ต่ำกว่า:
- ตัวอย่างเช่น หากคุณวิเคราะห์ชาร์ต 15 นาที อินดิเคเตอร์จะแสดงระดับสำคัญจากกรอบเวลารายวันหรือรายสัปดาห์ 🕒📅
- ช่วยให้คุณเห็นระดับบริบทสูงที่สำคัญโดยไม่ต้องออกจากชาร์ตปัจจุบัน 🌍🔍
แนวรับและแนวต้านจากกรอบเวลาที่ต่ำกว่าบนชาร์ตกรอบเวลาที่สูงกว่า:
- แม้จะไม่บ่อยนัก คุณก็สามารถดูระดับจากกรอบเวลาที่เล็กกว่า (เช่น 1 นาที หรือ 5 นาที) บนชาร์ตรายวันหรือรายสัปดาห์ได้ 🕒📅
- ซึ่งมีประโยชน์สำหรับการวิเคราะห์รายละเอียดภายในบริบทที่กว้างขึ้น 🔍📊
สรุป
The indicator analyzes price data by collecting highs and lows from specified timeframes, identifying local pivot points where price peaks or valleys occur. These points are grouped into zones representing support or resistance areas rather than precise lines. Each level is assigned a strength score based on the frequency of price touches and the clustering of key points, helping users prioritize the most significant and reliable levels.
Visualized on the chart as horizontal lines or colored zones, the indicator uses color coding to indicate the price's position relative to each level: red for resistance (price below level), green for support (price above level), and yellow when price is within the level’s range. This tool assists traders in making informed decisions on entries, exits, and stop-loss placements by highlighting where price may stop, bounce, or break with strength.
รีวิวจากลูกค้า
5 | 50 % | |
4 | 0 % | |
3 | 0 % | |
2 | 0 % | |
1 | 50 % |


