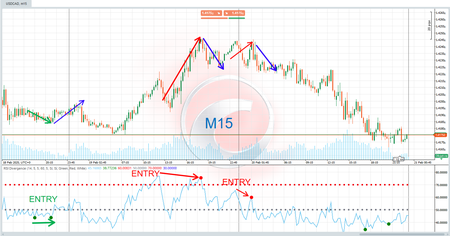
Pinescriptlabs Store indicators: Pinescriptlabs Store cBots : (cBot) Gold & BTC BreakoutSession Pivots(new)
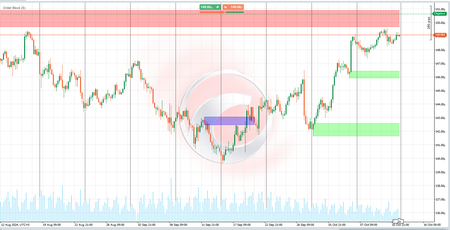
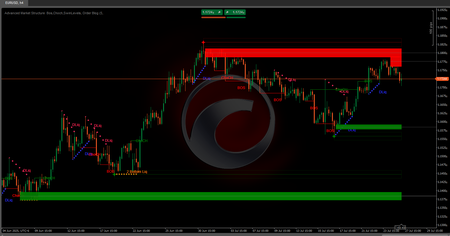
Advanced Market Structure: Bos, Choch, SwinLevels, Order Blocks, Market Structure & Liquidity Finder (New)
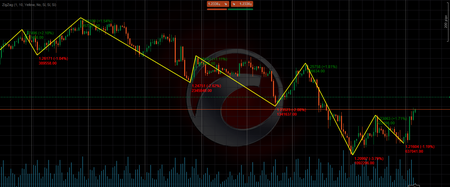
ZigZag Price Liquidity Projection
Trailing Smart Algorithm (new)
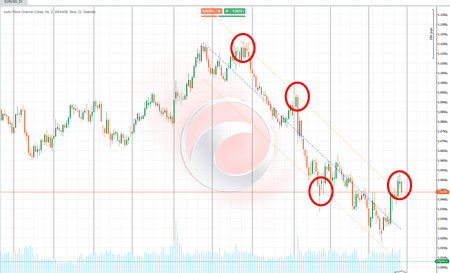
Prediction Based on Linreg & ATR
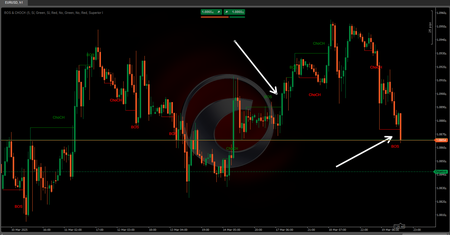
SmartTrend Support &
Resistance
Lines
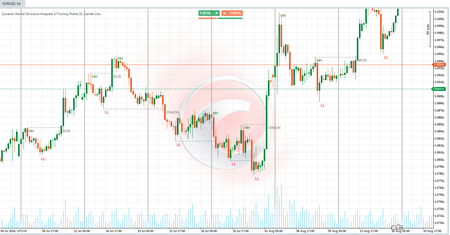
Dynamic
Market Structure
Analysis
of
Turning
Points
Fibonacci
Linear
Regression
Multi-timeframe
Auto
Support and
Resistance
Trend
Lines
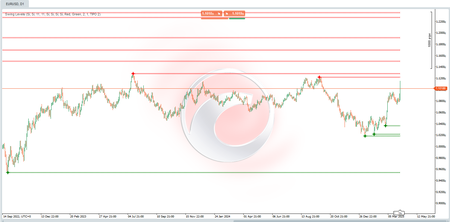
All
Support and
Resistance
Levels
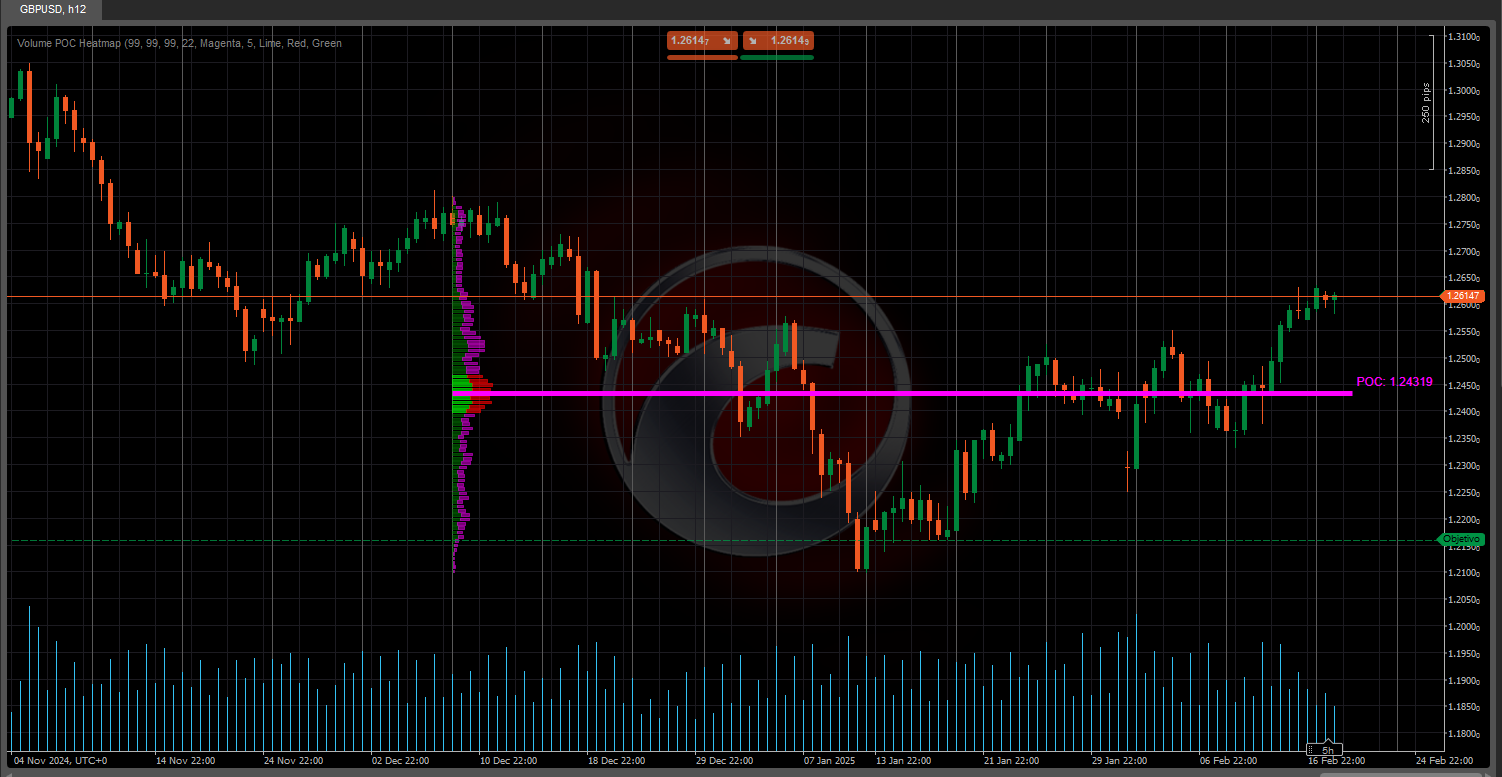
🔥 Volume POC Heatmap 🔥
This indicator is a Volume Profile that displays the distribution of traded volume across different price levels during a specific period. Its main goal is to identify key support/resistance zones and areas where the market has shown the most interest (high buying/selling activity). It’s super useful for:
- Detecting the Point of Control (POC) 🎯
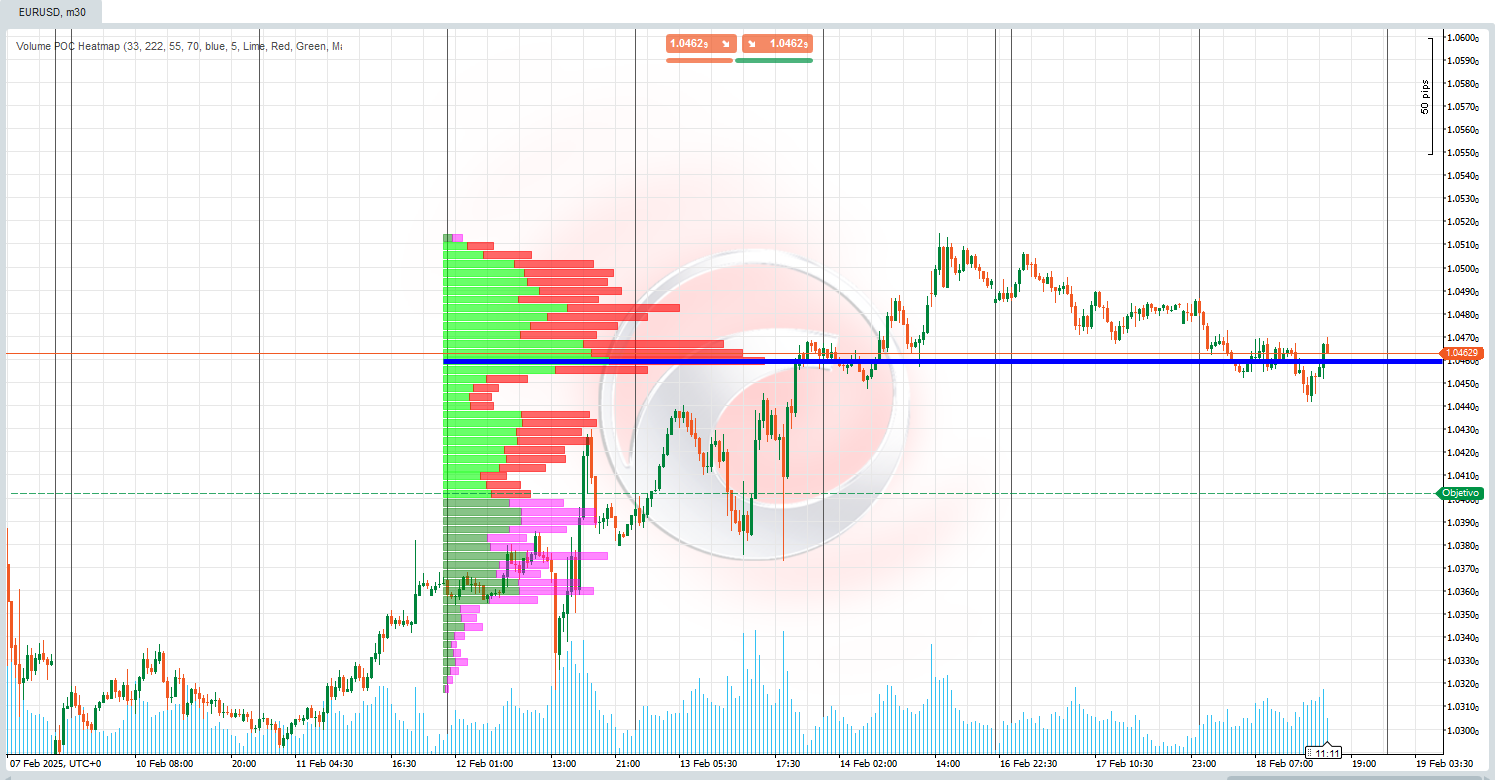
The price level with the highest volume, acting as a magnet for price action. - Visualizing the Value Area (VA)
The zone where a specific percentage of total volume is concentrated (e.g., 70%), indicating balance between buyers and sellers. - Differentiating Bullish and Bearish Volume 📈📉
Shows where buying power vs. selling pressure accumulates.
🧠 Key Logic & Calculations 🔢
- Price Range Division 📏
- The price range (from the lowest to the highest in the last B Bars ) is divided into Volume Cells (CNum) .
Example: If CNum = 33 , the range is split into 33 equidistant levels.
- The price range (from the lowest to the highest in the last B Bars ) is divided into Volume Cells (CNum) .
- Volume Distribution by Level 📊
- For each bar in the historical data:
- The volume associated with the body (difference between open and close) and wicks (highs and lows) is calculated.
- The volume is proportionally distributed across the price cells intersected by the bar.
Example: If a green (bullish) bar covers 3 cells, the volume is assigned mainly to those cells as "bullish volume."
- Point of Control (POC) Calculation 🎯
- The POC is the cell with the highest accumulated volume, representing the price where there was the most consensus between buyers and sellers.
- Value Area (VA) Calculation 🔄
- Expands from the POC upwards/downwards until it encompasses the specified % of total volume (e.g., 70%).
Example: If the VA ranges from 100 to 105 , it means 70% of the volume was traded within that range.
- Expands from the POC upwards/downwards until it encompasses the specified % of total volume (e.g., 70%).
- Visual Normalization 🖼️
- Volumes are scaled using a Scale Factor to adjust the width of the bars on the chart, making visualization easier.
🛠️ Key of the Volume POC Heatmap 💡
- Lack of Context in Traditional Volume Indicators 🤔
Classic volume indicators (like bar-by-bar volume) don’t show where the volume was traded. This indicator maps volume by price level, solving that issue. - Organic Support/Resistance Identification 🚀
Zones with high volume act as dynamic support/resistance, more reliable than static lines. - Detection of Imbalances ⚖️
Areas with predominantly bullish or bearish volume signal potential breakouts or reversals.
💡 Practical Use in Trading 📈
- POC as a Zone of Interest 🎯
- If the price approaches the POC, expect reactions like bounces or consolidations.
- Value Area (VA) as a Balance Zone 🔄
- If the price is outside the VA, it tends to return to it (magnetic effect).
- If the price is inside the VA, it may indicate consolidation.
- Bullish/Bearish Volume as Confirmation 🔍
- A spike in bullish volume at resistance suggests a potential breakout.
- High bearish volume at support indicates a possible breakdown.
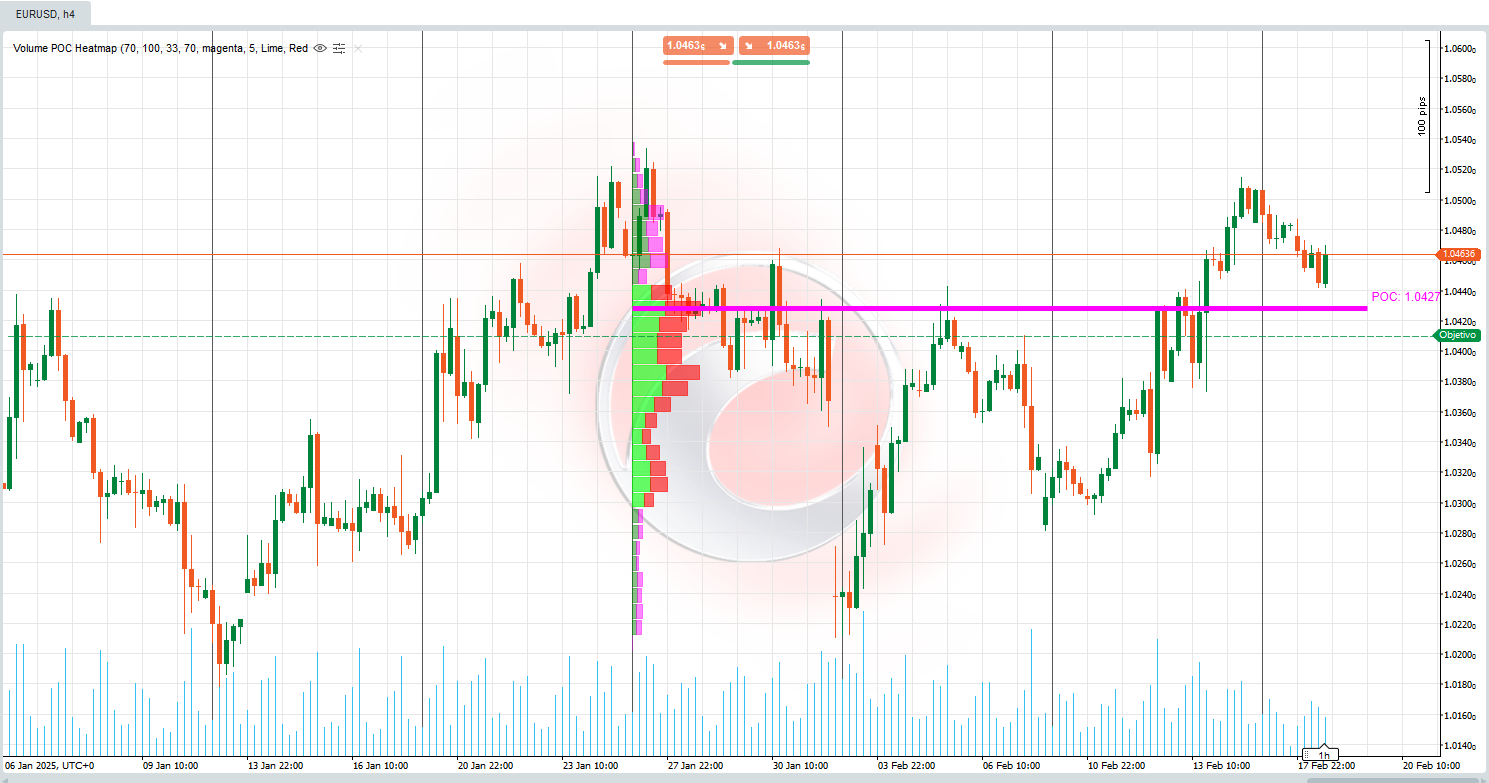
🌟 Example 📊
Parameters Used (Visible & Configurable by the User):
- Bars Back = 55 → Number of historical bars analyzed.
- Volume Cells = 33 → Number of divisions/cells in the price range.
- Value Area Volume % = 70 → Percentage of volume defining the Value Area.
Situation:
- The price breaks through a technical support level, but the volume in that zone is low (according to the profile).
- Later, the price returns to the Value Area (VA) defined by 70% of the total volume.
Interpretation:
- The breakout was false (due to low volume in the breakout zone).
- The market seeks to rebalance within the Value Area , where there’s higher activity (high volume density).
Action:
- Look for buying opportunities near the lower limit of the VA or the POC, as these are zones of high interest for market participants.
5 | 100 % | |
4 | 0 % | |
3 | 0 % | |
2 | 0 % | |
1 | 0 % |