
PIVOT POINTS, HIGH-LOW OF THE DAY
Indicator
108 downloads
Version 1.0, Mar 2026
Windows, Mac
Description
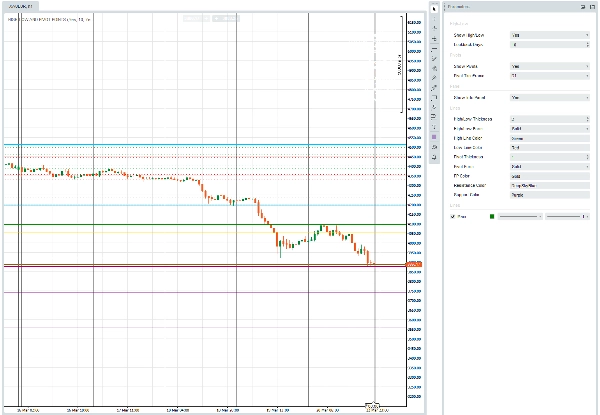
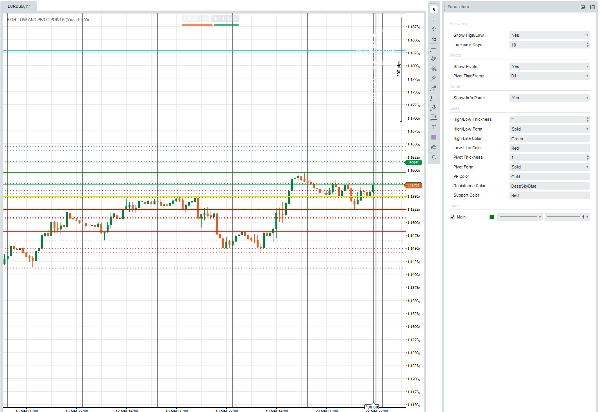
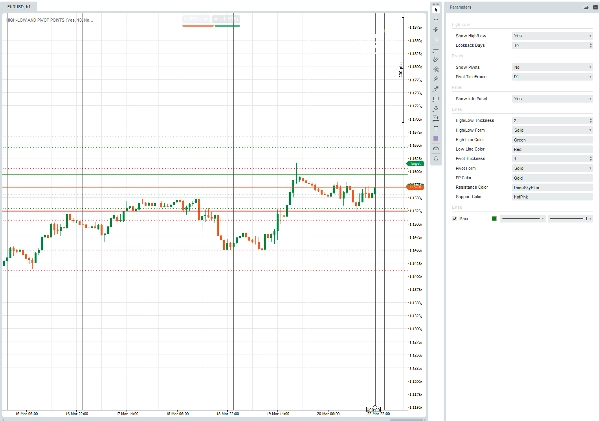
HIGH-LOW AND PIVOT POINTS is a cTrader overlay indicator that plots daily high/low price levels and classic pivot points directly on your chart.
Parameters at a glance:
GroupWhat you control
High-Low
Show/hide lines; how many past days to display (Lookback Days)
Pivots
Show/hide lines; which timeframe drives the pivot calculation (Daily, Weekly, etc.)
Panel
Show/hide the on-chart info box listing current prices and pivot levels
Lines
Thickness, style (Solid / Dotted / VeryDotted), and color for High, Low, PP, Resistance, and Support lines
What it draws:
- Today's High/Low in your chosen colors; prior lookback days in a lighter/thinner version of the same.
- Seven standard pivot levels — PP, R1–R3, S1–S3 — calculated from the previous completed bar of your selected pivot timeframe.
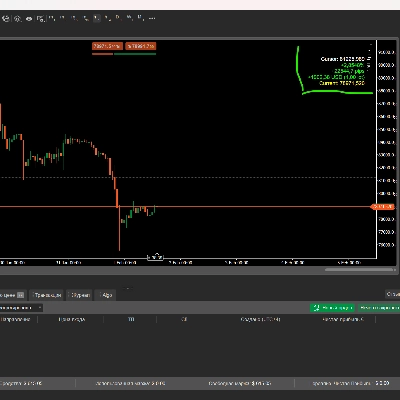
- A top-right info panel summarising live Day High/Low, the multi-day lookback range, and all seven pivot prices.
Summary
AI summary
The "Pivot Points, High-Low of the Day" indicator for cTrader overlays daily high and low price levels along with classic pivot points directly on trading charts. It visually displays today's high and low prices, as well as those from prior days based on a configurable lookback period. The indicator calculates and plots seven standard pivot levels—Pivot Point (PP), Resistance levels R1 to R3, and Support levels S1 to S3—derived from the previous completed bar of a selectable timeframe (e.g., daily or weekly). Users can customize visibility, line thickness, style (solid, dotted, very dotted), and colors for all lines including high, low, pivot, resistance, and support. An optional on-chart info panel summarizes live day high/low, multi-day range, and all pivot prices for quick reference. This tool supports multiple markets and symbols including Forex pairs (EURUSD, GBPUSD, NZDUSD, USDJPY), cryptocurrencies (BTCUSD), commodities (XAUUSD), indices (NAS100), and stocks. It is designed to assist traders in identifying key price levels and potential breakout or reversal points based on historical price data and pivot calculations.
Indicator profile
Customer reviews
0.0
Reviews: 0
Customer reviews
No reviews for this product yet. Already tried it? Be the first to tell others!
Discussion
FAQ
BTCUSD
Forex
Breakout
Indices
EURUSD
Commodities
GBPUSD
NZDUSD
Crypto
Stocks
XAUUSD
NAS100
USDJPY
Products available through cTrader Store, including trading bots, indicators and plugins, are provided by third-party developers and made available for informational and technical access purposes only. cTrader Store is not a broker and does not provide investment advice, personal recommendations or any guarantee of future performance.
More from this author


Price
48
Sales
306
Free installs