"MARKET STRUCTURE INDICATOR" logo
Indicator
Version 1.0, May 2026
Windows, Mac
5.0
Reviews: 2
"MARKET STRUCTURE INDICATOR" uploaded image
30
Sales
300
Free installs

Stop guessing the market structure, this indicator is For You !

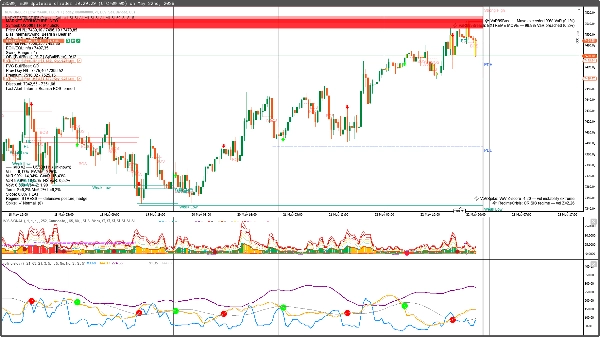
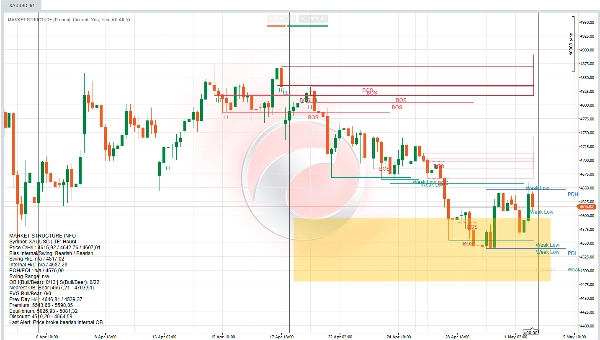
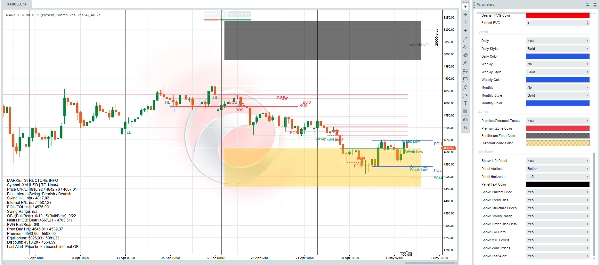
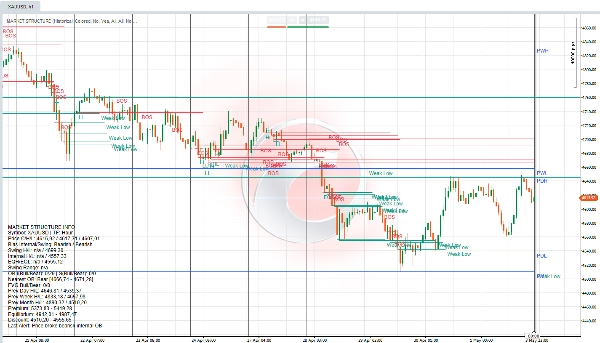
Market Structure indicator that automatically identifies and plots key market structure elements, including BOS (Break of Structure), CHoCH (Change of Character), Order Blocks, Fair Value Gaps, Equal Highs/Lows, and Premium/Discount Zones. Features dual-timeframe structure detection (Internal & Swing), multi-timeframe level tracking (Daily/Weekly/Monthly), and comprehensive real-time alerts. Fully customizable with colored/monochrome display modes, confluence filters, and a detailed info panel.

💰 One-Time Purchase | Unlimited Usage | No Subscriptions

Pay once, use forever across all your cTrader accounts. No monthly fees, no renewals, no hidden costs.

How to Trade with This Indicator

Trend Identification

  • Bullish Bias: Price above swing structure with consecutive BOS markers pointing up
  • Bearish Bias: Price below swing structure with consecutive BOS markers pointing down
  • Reversal Signal: CHoCH indicates potential trend change—wait for confirmation

Entry Strategies

Order Block Entries:

  • Bullish: Enter long when price retraces to bullish OB (blue zone) in uptrend
  • Bearish: Enter short when price retraces to bearish OB (red zone) in downtrend
  • Set stop-loss below/above the order block

Fair Value Gap Entries:

  • Price often returns to fill FVGs before continuing trend
  • Enter in the direction of the trend when the price taps into the FVG zone
  • Use FVG edges as support/resistance

Key Levels for Confluence

  • Strong High/Low: Unbroken swing points—act as major S/R
  • Weak High/Low: Broken swing points—potential liquidity targets
  • Equal Highs/Lows: Liquidity pools—expect breakouts or reversals
  • Premium Zone (above 50%): Look for shorts in bearish structure
  • Discount Zone (below 50%): Look for longs in a bullish structure

Risk Management

  • Use Internal Structure for tighter stops (scalping)
  • Use Swing Structure for wider stops (swing trading)
  • Watch for OB mitigation alerts—exit if order block is broken
  • Monitor MTF levels (Daily/Weekly highs/lows) for major support/resistance

Practical Example

  1. Identify Trend: Swing structure shows bullish BOS sequence
  2. Wait for Pullback: Price retraces to the discount zone
  3. Find Entry: Bullish order block or FVG aligns with pullback
  4. Confirm: Internal structure shows CHoCH back to bullish
  5. Enter Long: At OB/FVG with stop below swing low
  6. Target: Next weak high or liquidity pool (equal highs)

Pro Tip: Combine alerts—when price breaks bearish internal OB while forming bullish CHoCH in discount zone, high-probability long setup.

⚠️ Disclaimer

DATARUMALGORITHMICA develops and provides technical indicators for trading platforms as a software developer. The use of these indicators is entirely at the discretion of individual traders, who freely choose to incorporate them into their personal trading analysis and decision-making processes. This indicator is a technical analysis tool and does not constitute financial advice, investment recommendations, or trading signals. CFD and forex trading involve substantial risk of loss and is not suitable for all investors. All trading decisions executed by users of this indicator are the sole responsibility of the customers. DATARUMALGORITHMICA bears no responsibility for any trading outcomes, losses, or damages resulting from the use of this software. Users should ensure they fully understand the risks involved and seek independent advice if necessary.


Indicator profile
Indicator category
Market structure (SMC)
Output type
Visualisation
Data requirements
Tick data
Bars only
Supported signals
Level touch
Level break
Session opening range
5.0
Reviews: 2
5
100 %
4
0 %
3
0 %
2
0 %
1
0 %
Customer reviews
May 16, 2026
May 8, 2026
Premium/Discount
Fair Value Gap
Key Levels
BOS
Order Block
CHOCH
Market Structure
Products available through cTrader Store, including trading bots, indicators and plugins, are provided by third-party developers and made available for informational and technical access purposes only. cTrader Store is not a broker and does not provide investment advice, personal recommendations or any guarantee of future performance.

More from this author

cBot
RSI
MACD
+9
EURGBP MARKET ORDER TRADING ALGORITHM
2.41
Profit factor
13.69%
Max drawdown
cBot
VWAP
Signal
+4
Gold Profit Scalper Machine
4
Profit factor
35%
Max drawdown
Indicator
Signal
Order Flow Market Depth Pro | Footprint & DOM
Indicator
Volume
Moving Average
Multi-Timeframe Rolling Volatility Indicator - Smart Volatility Breakout System
Indicator
Forex
BTCUSD
+12
Pro Structure Patterns Detector
cBot
ATR
Volume
+5
HEDGE GRID | Advanced Grid & Hedging Algorithm
7%
ROI
12
Profit factor
3.5%
Max drawdown
cBot
ATR
Volume
+5
Bitcoin Fractal AlphaEdge
7.97
Profit factor
30.8%
Max drawdown
Indicator
EMA
CHOCH
+1
Volatility Oscillator & Detector: Professional Conditional Volatility Predictive. Stop reacting to volatility
Indicator
Channel
Key Levels
+2
SATNAV Trade Indicator: Adaptive Supertrend & Trade Management System
Indicator
VWAP
Volume
+2
VWAP Bands and Swing Wick Structure Indicator
Indicator
OBV
Volume
+2
Volume Profile, Order Flow Imbalance & Liquidity Engine Indicator
Indicator
Crypto
Stocks
Advanced Volatility Suite - Institutional-Grade Volatility Forecasting

You may also like

Indicator
AI
ATR
+15
AI-powered Smart indicator. Dual neural networks self-train on live trades. Liquidity sweep + SMC. All pairs/timeframe.
Indicator
ADX
ATR
+5
Lass System: Non-repainting M5 cTrader indicator with winrate dashboard & multi-asset alerts (Gold, BTC, EURUSD).
Indicator
SMC
VWAP
+16
It calculates Anchored VWAP and StdDev bands from a user-defined start date for cTrader charts.
Indicator
Prop
Forex
+1
Smart support/resistance indicator with rejection-only Buy/Sell signals designed for H1 charts.
Indicator
Liquidity Grab
Liquidity Sweep
+1
CRT Sweep Tracker is an advanced panel for Candle Range Theory (CRT) traders to track HTF sweeps and manage live trades.
Indicator
Volume
FSP_CumulativeDelta
Indicator
SMC
Prop
+13
Perfect for traders who demand a clear overview of multiple timeframes at a glance.
Indicator
Signal
Scalping
Average accuracy of around 60% to 70% on 45min timeframes it is highly recommended to use stop losses
Indicator
RSI
Forex
+10
All in One indicator designed to reveal Market Sentiment.
Indicator
EMA
MACD
+1
The EWO is used to identify trading trends and opportunities in the financial markets.
Indicator
ATR
SMC
+17
Adaptive Swing-Anchored VWAP that tracks market structure shifts with precision and clarity.
Indicator
Prop
ZigZag
+5
All-in-One ICT/SMC Institutional Framework — Ranges, Structure, Liquidity, Fibonacci & Time Engine.
Indicator
Forex
Crypto
+5
Volume Imbalance Bars Indicator - brings institutional-grade market microstructure analysis to cTrader.
Indicator
Forex
Crypto
+3
Enhance Pitchfork & Price Channels in cTrader with customizable Equidistant and Fibonacci levels.
Indicator
RSI
Forex
+10
Unlock Stochastic RSI PRO in cTrader! Overlay RSI, highlight zones, and identify divergences with customizable settings.
Indicator
ADX
ATR
+5
Identify high-probability weeks before they happen. Quarterly cycles + weekly bias across 8 instruments, live.
Indicator
AI
ATR
+27
The Fibonacci Automated Levels Indicator is a smart trading tool that automatically detects the most recent market.
Indicator
AI-assisted
Predictive Monte Carlo Engine Forecast future price paths using institutional-grade statistical models and probability
30
Sales
300
Free installs