Indicator
Indices
E7 BlackScholes Model
"E7 BlackScholes Model" logo
5.0
03/09/2025
181
Desktop
"E7 BlackScholes Model" uploaded image

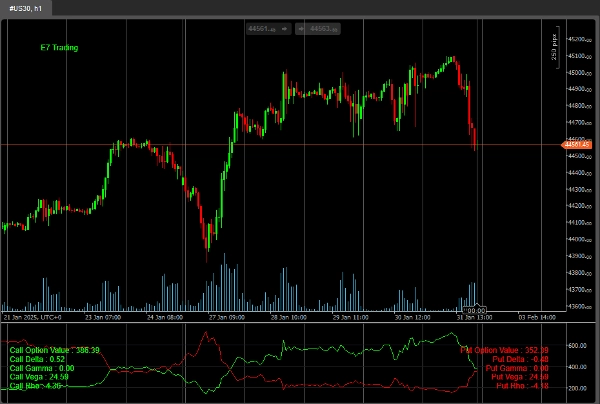
This is a very simple example of using the ‘Math.Numerics’ package inside cTrader to calculate Option pricing using the BlackScholes model.

Future version will include more sophisticated implementations.

This should only be used for indices for now, thanks.

Happy hunting!

5.0
Reviews: 1
5
100 %
4
0 %
3
0 %
2
0 %
1
0 %
Customer reviews
August 18, 2025
Pros: Calculates Black–Scholes theoretical option price and Greeks (Delta, Gamma, Theta, Vega) in real‑time. Lightweight and intuitive interface. Great for risk management and option analysis. Cons: No alerts or tooltips. Lacks template saving and real‑price comparison. Assumes constant volatility
More from this author
E7 Polynomial Regression Channel
Polynomial Regression Channel which also reflects the volatility of the underlying asset.
E7 BBKG Indicator
E7 BBKG indicator with 80% plus accuracy used to show both, possible reversal and trend.
E7 Volume Profile
E7 Volume Profile, more modern look and feel.
E7 Harmonic Structures Basic
E7 Harmonic Structures Basic.
E7 Correlation Dashboard
E7 Correlation Dashboard.
Indicator
Bollinger
E7 Indicators Free Overlays
Bollinger Band Cloud, Heiken Ashi, Trend Follower and Parabolic SAR.
Indicator
Bollinger
E7 Indicators Free Studies
ADXR, KDJ, SineWave, Bollinger Band Volatility and AEOscillator.
E7 BBKG NumSharp Sample
NumSharp and Pandas Sample CODE ONLY!!! Our mission is to make Machine Learning inside cTrader easier for everyone.
E7 cTrader User ID
cTrader ID
You may also like
Automatic Fibonatti - Renko
Automatically plots Fibonacci retracement levels using the highest and lowest points of a customizable time range.
Indicator
NAS100
Indices
XAUUSD
+2
AlgoCorner DonchianPSAR
Visualize market asymmetry like never before — steady climbs meet sudden drops with the Donchian PSAR
Indicator
Indices
Prop
Breakout
+7
NTNPICLL
NTNPICLL is a tool to check the best trading hours for the assets and also includes the highest and lowest point
Indicator
XAUUSD
Commodities
Forex
+2
IM_AngleIndicator
Indicator that calculates the slope of a moving average (SMA) and displays the value of the slope in degrees
Market Entropy
Market entropy + DC. Spot crystallization/chaos shifts with an optional on-chart overlay.
Indicator
Forex
Supertrend
Signal
AlgoCorner 1-100 Moving Averages
Draw as many Moving Averages as you need from a simple indicator.
Indicator
NAS100
Indices
Prop
+6
VolumeThermometer
Heatmap of intra-HTF volume (POC/VA) built from LTF tick data; paints current candle and auto-loads visible history.
Indicator
NAS100
RSI
NZDUSD
+19
Bounty stop
the indicator that hunts stop-loss liquidity before the big players do.
Indicator
Stocks
Forex
Crypto
PinBarCandlestickPattern
PinBarCandlestickPattern Indicator
DEnvelopSystem
DEnvelop is a high-performance trading indicator engineered for scalpers and intraday strategists who demand precision.
Indicator
Grid
RSI
Breakout
+14
StopATR
Displays a dynamic stop loss line based on the Average True Range (ATR), helping traders visualize volatility-based risk
HTFBB
Plot higher-timeframe Bollinger Bands for clearer structure, pullback zones, and breakout signals—without switching char
SpreadCalculator - BossFXTrader
Spread Calculator to calculate the difference between two prices or values.
Indicator
Indices
RSI
Bollinger
Clustering
Clustering tool for traders with visual insights into market patterns.
Indicator
RSI
XAUUSD
ATR
+3
RSI NextGen
The RSI NextGen is an advanced and modernized version of the classic Relative Strength Index (RSI)
Indicator
Indices
Prop
Stocks
+5
New Way Sar - Free
The Parabolic SAR, or "Stop and Reverse," is a dynamic technical analysis tool
Repiptor Candlescope Lite
Candlestick pattern detector lite version
Indicator
NAS100
RSI
NZDUSD
+15
RSI + EMA Crossover Signals
Dual confirmation RSI + EMA crossover signals with visual alerts and dynamic ATR offsets.