Brokers & props
For business
00
Days
:
00
Hours
:
00
Minutes
:
00
Seconds
E7 Volume Profile
"E7 Volume Profile" logo
Since 18/12/2024
Sales
2
Free installs
3308
"E7 Volume Profile" uploaded image"E7 Volume Profile" uploaded image"E7 Volume Profile" uploaded image

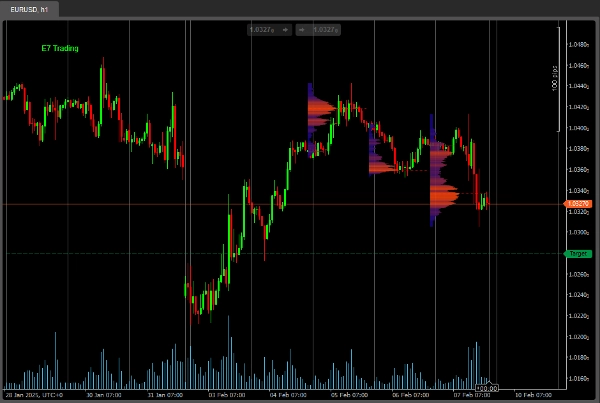
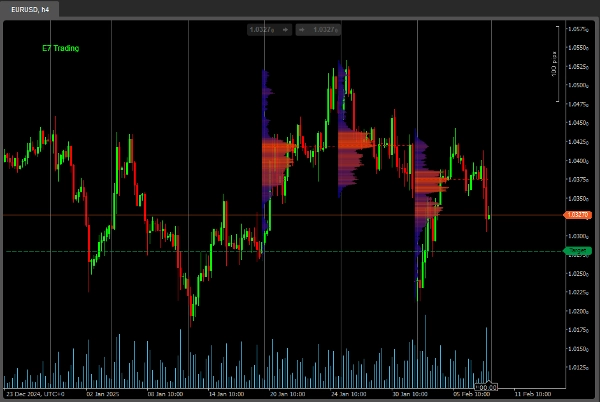
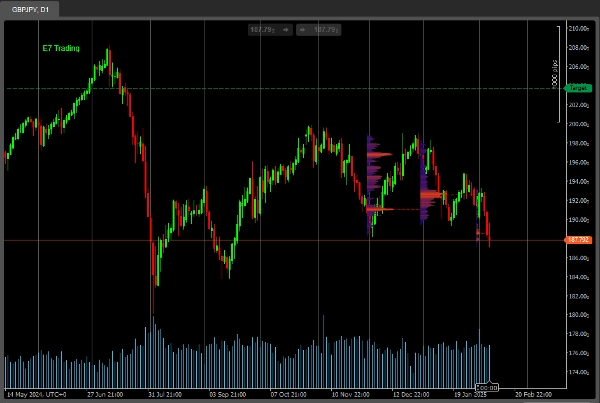
This is a simple Volume Profile indicator, customised for a more modern look and feel.

This basic version is limited to only 3 'Lookback Periods'.

The full version is coming soon, watch this space.

Happy hunting!

4.6
Reviews: 3
5
67 %
4
33 %
3
0 %
2
0 %
1
0 %
Customer reviews
October 24, 2025
Good job!
July 14, 2025
Pros: Clearly visualizes volume distribution with POC, VAH, VAL zones. Customizable and stable across timeframes. Cons: No tooltips or alerts. Lacks template saving and dynamic profile history. Requires confirmation tools for trading signals.
July 9, 2025
pretty good! How do I change the period of the volume profile please?
More from this author
E7 Polynomial Regression Channel
Polynomial Regression Channel which also reflects the volatility of the underlying asset.
E7 BBKG Indicator
E7 BBKG indicator with 80% plus accuracy used to show both, possible reversal and trend.
E7 Harmonic Structures Basic
E7 Harmonic Structures Basic.
E7 Correlation Dashboard
E7 Correlation Dashboard.
Indicator
Bollinger
E7 Indicators Free Overlays
Bollinger Band Cloud, Heiken Ashi, Trend Follower and Parabolic SAR.
Indicator
Indices
E7 BlackScholes Model
Option pricing using the BlackScholes model and the Math.Numerics packages
E7 BBKG NumSharp Sample
NumSharp and Pandas Sample CODE ONLY!!! Our mission is to make Machine Learning inside cTrader easier for everyone.
Indicator
Bollinger
E7 Indicators Free Studies
ADXR, KDJ, SineWave, Bollinger Band Volatility and AEOscillator.
E7 cTrader User ID
cTrader ID
You may also like
MAMA CANDLES
This code implements the MESA Adaptive Moving Average (MAMA) indicator, it creates candles based on MAMA calculations.
Indicator
Indices
Commodities
Stocks
+2
Balance of Power
Igor Levshin's Balance of Power measuring buyer vs seller strength for momentum and divergence analysis.
Indicator
Grid
NAS100
RSI
+21
Market Cipher B
Market Cipher B
Indicator
Indices
XAUUSD
Prop
+8
Average Cost Price
Average Cost Price helps you keep track of your open positions on the chart. In doing so, it provides lines and explanat
Indicator
NAS100
NZDUSD
XAUUSD
+14
ATR
Master volatility! ATR with visual alerts for precise trades and professional stops. Profit with clarity.
Indicator
Indices
RSI
Stocks
+3
Advanced RSI Indicator
Advanced RSI Indicator with multi-MA smoothing, Bollinger Bands, divergence detection, and fill zones for cTrader.
Indicator
Indices
Stocks
Forex
+1
Daily Fibo
Daily Fibo
Indicator
Breakout
Stocks
Commodities
+1
Advanced Donchian Zones
MTF Donchian: Identify trend breakouts & key zones with precision. Perfect for swing & day traders seeking accuracy!
IR Coral
Coral indicator
Risk Reward Guardian Scalping Swing Intraday Assistant
Trade fearlessly: auto-adjusts order blocks, manages risks, and ensures precision.
Indicator
Breakout
3 Bar Triangle by Linda Raschke
3 bar triangle = high below 2 day high, low above 2 day low
Price Speed or Acceleration v1
This Indicator will display either the speed or the acceleration of the current symbol.
Indicator
Indices
Breakout
Stocks
+3
Gann_Pivot_Vision
Gann Pivot Vision is an innovative analytical tool that combines classic pivot reversal levels and Gann geometry
Indicator
Grid
NAS100
NZDUSD
+17
Super Wick
Super Wick detects powerful candle rejections: fractal long-wicks, HTF resonance zones, and a WSI gauge.
Indicator
RSI
Breakout
Supertrend
Leverage Liquidation Map
📊 Liquidation Map: Potential areas where highly leveraged investors might face liquidations.
[Hamster-Coder] Moving Average
Universal Moving Average indicator with extended features
Indicator
NAS100
NZDUSD
Breakout
+16
RangeFilter PRO
Hybrid adaptive trend filter with clean Buy/Sell signals, dynamic bands and zero-repaint analysis.