
E7 Harmonic Structures Basic
Indicator
647 downloads
Version 1.0, Feb 2025
Windows, Mac
5.0
Reviews: 2
Description
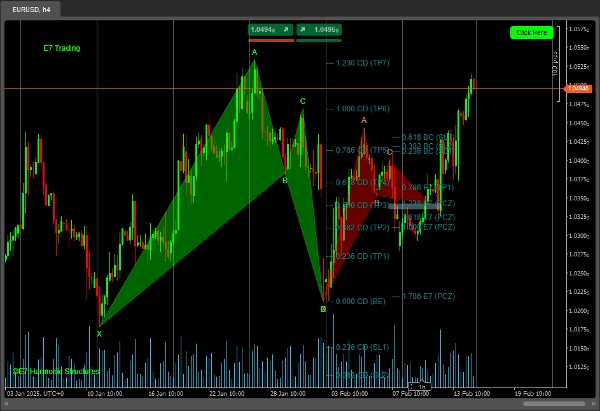
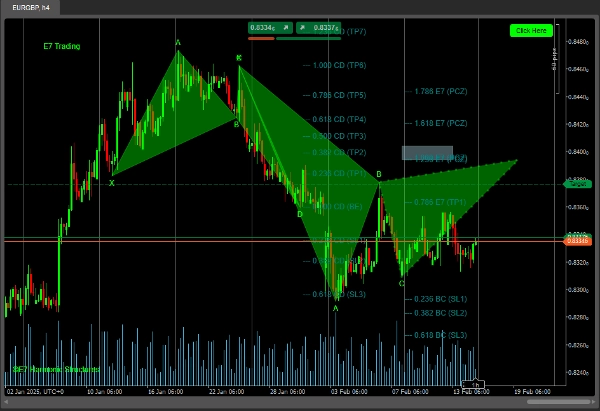
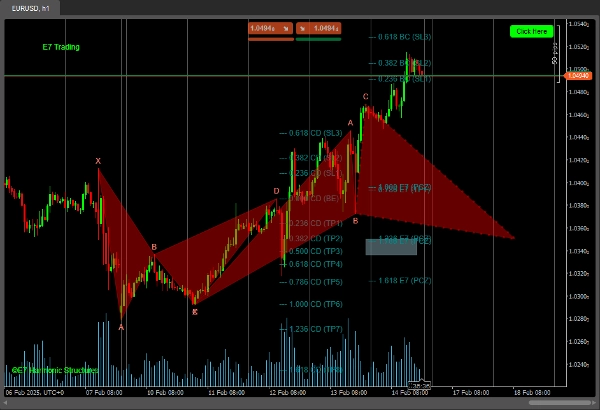
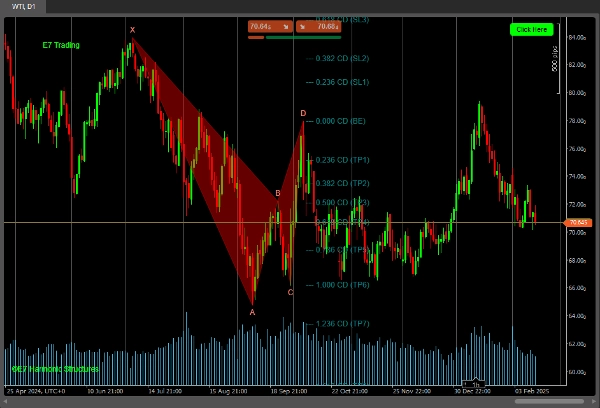
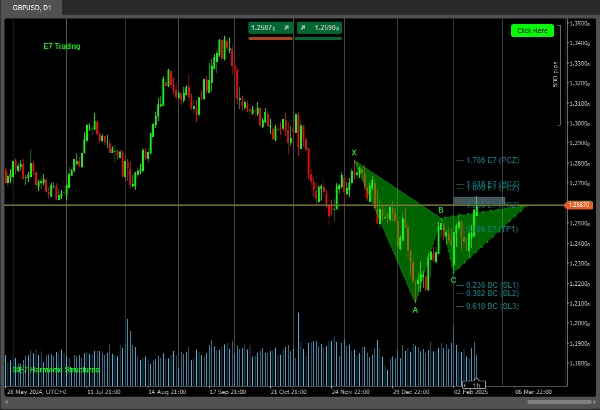
The E7 Harmonic Structures Basic indicator includes the following:
Point 'C' Structures and Point 'D' Structures.
Fib Projections, PCZ and PRZ for better analysis, as taught in E7 Strategies.
However, it only includes a limited number of the following Structures:
- Gartley
- Bat
- Butterfly
- Crab
- Cypher
* This is a Beta version.
The full indicator, includes many more Structures and is coming soon.
Happy hunting!
Summary
AI summary
E7 Harmonic Structures Basic is a technical indicator designed for harmonic pattern analysis in trading. It identifies Point 'C' and Point 'D' structures and incorporates Fibonacci projections, Potential Completion Zones (PCZ), and Potential Reversal Zones (PRZ) to support detailed market analysis as outlined in E7 Strategies. The indicator currently detects a limited set of harmonic patterns, including Gartley, Bat, Butterfly, Crab, and Cypher formations. This version is labeled as Beta, with a more comprehensive version including additional structures planned for future release.
Indicator profile
Customer reviews
5.0
Reviews: 2
5 | 100 % | |
4 | 0 % | |
3 | 0 % | |
2 | 0 % | |
1 | 0 % |
Customer reviews
August 12, 2025
Pros: Detects Bat, Gartley, Butterfly, Shark patterns automatically with PRZ visualization. Flexible settings. Cons: No tooltips or alerts. Missing pattern history log and template saving. Requires external confirmation (volume or PA).
April 22, 2025
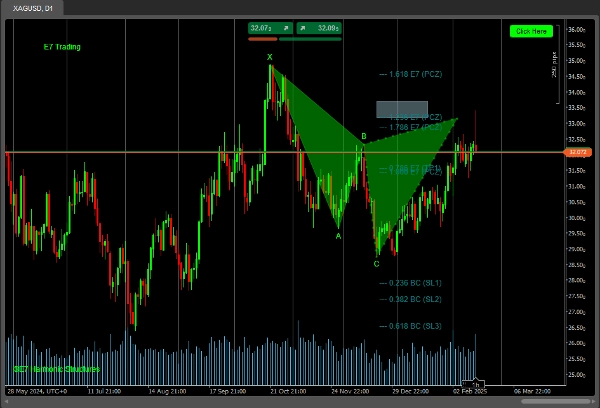
I am currently testing your indicator and I must say it is very interesting. I am a fan of Fibonacci and today, April 22, 2025, it showed two beautiful structures on gold. Like from a book about trading. Best regards and I wish you continued success in improving the product. Artur
Discussion
FAQ
Products available through cTrader Store, including trading bots, indicators and plugins, are provided by third-party developers and made available for informational and technical access purposes only. cTrader Store is not a broker and does not provide investment advice, personal recommendations or any guarantee of future performance.
More from this author


!["[Hamster-Coder] Pivot Points (Demo)" logo](https://cdn.ctrader.com/image/webp/87b54299-8c73-4942-9207-4bc6db824811_31153)


Price
Since 18/12/2024
2
Sales
4.27K
Free installs