
KDJ
Indicator
255 downloads
Version 1.0, Dec 2024
Windows, Mac
5.0
Reviews: 1
Description
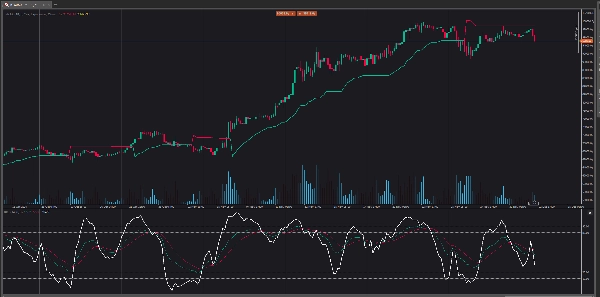
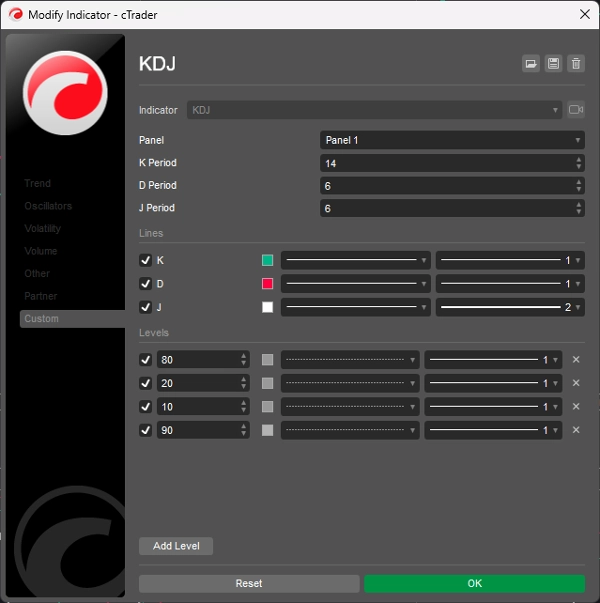
The KDJ oscillator display consists of 3 lines (K, D and J - hence the name of the display) and 2 levels. K and D are the same lines when using the stochastic oscillator. The J line represents the deviation of the D value from the K value. The convergence of these lines indicates new trading opportunities. Like the Stochastic Oscillator, oversold and overbought levels correspond to the times when the trend is likely to reverse.
Summary
Indicator profile
Customer reviews
5.0
Reviews: 1
5 | 100 % | |
4 | 0 % | |
3 | 0 % | |
2 | 0 % | |
1 | 0 % |
Customer reviews
August 18, 2025
Pros: Three-line stochastic oscillator (K, D, J) that identifies overbought/oversold levels and momentum shifts. Supports divergence analysis and crossovers between K and D as trading signals. Lightweight and responsive. Cons: No alerts, tooltips, or settings presets. J‑line can generate outlier v
Discussion
FAQ
Products available through cTrader Store, including trading bots, indicators and plugins, are provided by third-party developers and made available for informational and technical access purposes only. cTrader Store is not a broker and does not provide investment advice, personal recommendations or any guarantee of future performance.


!["[Hamster-Coder] Pivot Points MTF" logo](https://cdn.ctrader.com/image/webp/4c143e5a-309c-40e3-a578-f04d1e133ffa_31159)


Price
2
Sales
6.89K
Free installs