
Chaikin Money Flow
Indicator
131 downloads
Version 1.0, Dec 2024
Windows, Mac
5.0
Reviews: 1
Description
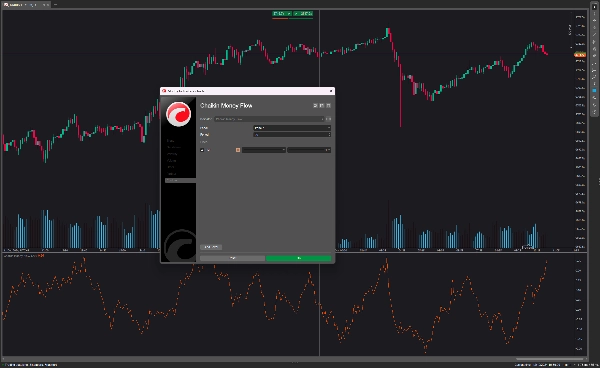
Chaikin money flow's primary purpose is to distinguish between periods of accumulation and distribution of a security. When the indicator is above the zero line, it indicates the security is experiencing net accumulation, suggesting that investors are buying the asset.
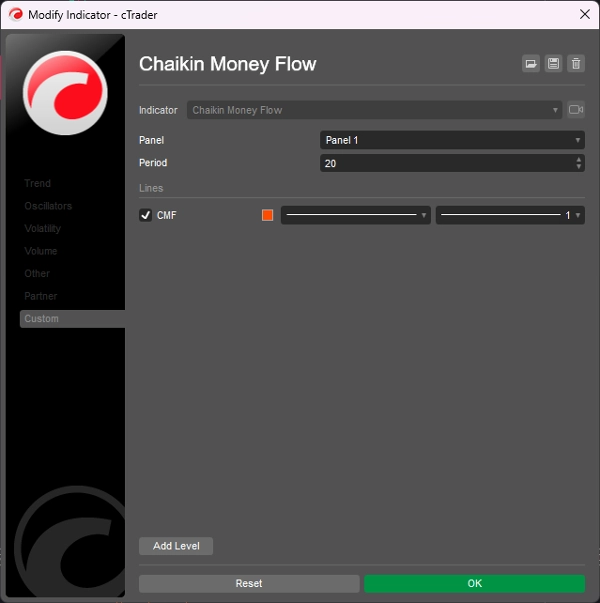
- Chaikin Money Flow settings with values over 30 make the indicator less sensitive. This will result in fewer, but better quality signals.
- Chaikin Money Flow settings with values below 20 make the indicator over-sensitive. This will result in more market noise.
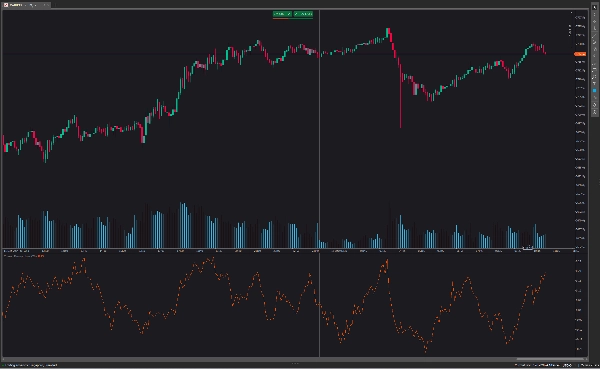
- It indicates a continued uptrend when the CMF indicator crosses the zero line from above and generates long/buy signals.
- It indicates a continued downtrend when the CMF indicator crosses the zero line from below and generates short/sell signals.
Summary
AI summary
The Chaikin Money Flow (CMF) indicator is designed to identify periods of accumulation and distribution for a security. When the CMF value is above zero, it signals net accumulation, indicating buying pressure. Conversely, values below zero suggest distribution or selling pressure. The indicator’s sensitivity can be adjusted: settings above 30 reduce sensitivity, producing fewer but higher-quality signals, while settings below 20 increase sensitivity, resulting in more market noise. Key signals include a continued uptrend when the CMF crosses the zero line from above, generating buy signals, and a continued downtrend when it crosses from below, generating sell signals. This tool helps traders assess buying and selling momentum to inform trading decisions.
Indicator profile
Customer reviews
5.0
Reviews: 1
5 | 100 % | |
4 | 0 % | |
3 | 0 % | |
2 | 0 % | |
1 | 0 % |
Customer reviews
August 18, 2025
Reliable volume-based trend confirmation, easy to read, customizable period. Cons: No alerts, no MTF analysis, limited filtering options.
Discussion
FAQ
Products available through cTrader Store, including trading bots, indicators and plugins, are provided by third-party developers and made available for informational and technical access purposes only. cTrader Store is not a broker and does not provide investment advice, personal recommendations or any guarantee of future performance.


Price
2
Sales
6.95K
Free installs