
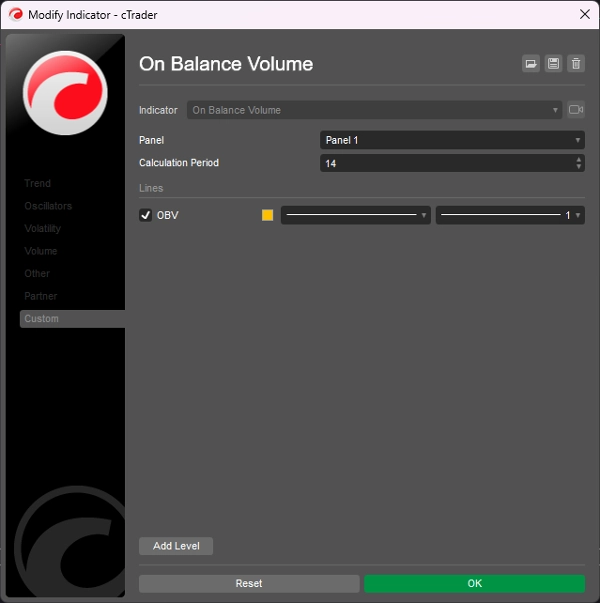
On Balance Volume
Indicator
253 downloads
Version 1.0, Dec 2024
Windows, Mac
5.0
Reviews: 1
Description
On Balance Volume (OBV) measures buying and selling pressure as a cumulative indicator that adds volume on up days and subtracts volume on down days.
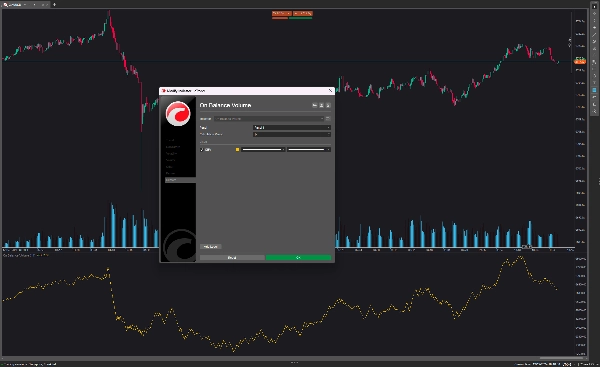
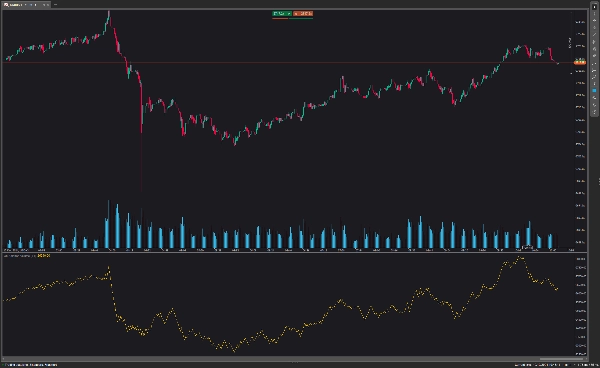
The On Balance Volume is displayed at the bottom of the chart. The OBV line goes up when today's closing price grows and goes down when yesterday's closing price is higher than the current one.
The OBV indicator generally identifies a breakout before the price line does and helps in establishing a clear upward trend. If you want to trade with this strategy, you open a forex position at the breakout price level and place a stop loss above the recent high swing
Summary
AI summary
On Balance Volume (OBV) is a technical indicator that measures buying and selling pressure by cumulatively adding volume on days when the closing price rises and subtracting volume on days when it falls. Displayed at the bottom of the chart, the OBV line moves upward when today's closing price exceeds the previous day's and moves downward when it is lower. This indicator is used to identify potential breakouts ahead of price movements and to confirm upward trends. Traders using OBV may open positions at breakout price levels and set stop losses above recent high swings. The indicator is applicable in forex markets and supports breakout trading strategies.
Indicator profile
Customer reviews
5.0
Reviews: 1
5 | 100 % | |
4 | 0 % | |
3 | 0 % | |
2 | 0 % | |
1 | 0 % |
Customer reviews
August 18, 2025
Pros: A lightweight cumulative volume indicator that confirms price moves and detects divergences. Excellent for analyzing trend strength and sentiment. Cons: No alerts, tooltips, or template features. Signals may lag in volatile or manipulated markets.
Discussion
FAQ
Forex
Breakout
Products available through cTrader Store, including trading bots, indicators and plugins, are provided by third-party developers and made available for informational and technical access purposes only. cTrader Store is not a broker and does not provide investment advice, personal recommendations or any guarantee of future performance.


!["[Stellar Strategies] Market Session Ultimate" logo](https://cdn.ctrader.com/image/webp/61ffd537-0125-4246-9e72-42eca1791d64_28232)


Price
2
Sales
6.95K
Free installs