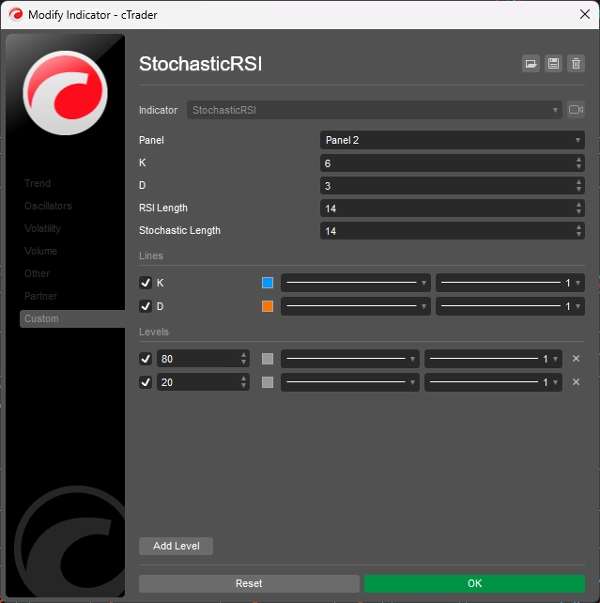
Brokers & props
For business
00
Days
:
00
Hours
:
00
Minutes
:
00
Seconds
Indicator
RSI
Indices
"StochasticRSI" logo
5.0
03/09/2025
979
Desktop
Since 03/10/2024
Sales
2
Free installs
6057
"StochasticRSI" uploaded image"StochasticRSI" uploaded image"StochasticRSI" uploaded image

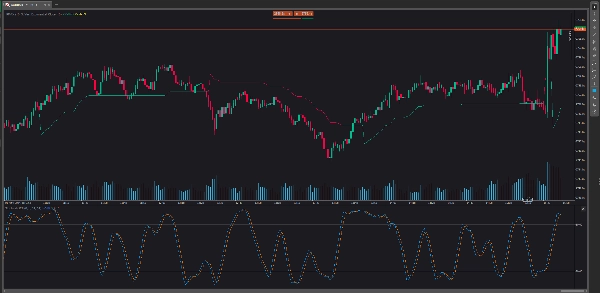
Stochastic RSI (StochRSI) is a technical analysis indicator used to support stock market prediction by comparing a security's price range to its closing price. StochRSI is unique in that it focuses on market momentum and is good at reading overbought and oversold market conditions. StochRSI differs from other technical indicators, such as the Relative Strength Index (RSI), because it moves from overbought to oversold prices faster than the RSI.

5.0
Reviews: 1
5
100 %
4
0 %
3
0 %
2
0 %
1
0 %
Customer reviews
July 9, 2025
Pros: Combines Stochastic Oscillator and RSI for improved overbought/oversold detection. Easy to set up, stable on all timeframes. Cons: No tooltips or alerts. Requires confirmation from trend indicators to avoid false signals. Limited customization options.
More from this author
Top-rated
Free
Indicator
ATR
Supertrend
It's a combination of two trailing stop loss and the other one is well-known ATR-based SuperTrend.
cBot
Grid
RSI
XAUUSD
+18
Investion X V1.9 - Intelligent Filter-Based Trading System
Trading system combining martingale strategy with multi-layered technical analysis and comprehensive protection features
Indicator
Indices
AI
Machine Learning Momentum Index
The Machine Learning Momentum Index (MLMI) represents the next step in oscillator trading.
Laguerre RSI
Laguerre RSI is based on John EHLERS' Laguerre Filter to avoid the noise of RSI.
The KDJ oscillator display consists of 3 lines (K, D and J - hence the name of the display) and 2 levels.
Indicator
Breakout
Forex
On Balance Volume
On Balance Volume (OBV) measures buying and selling pressure as a cumulative indicator.
Quantitative Qualitative Estimation
The QQE (Quantitative Qualitative Estimation) Weighted Oscillator improves its original version by weighting the RSI.
Indicator
Breakout
Stocks
Signal
Darvas Box
The Darvas Box involves identifying "boxes" or trading ranges where a stock's price consolidates before breaking out.
Indicator
Indices
Breakout
Stocks
+3
Ichimoku Cloud Indicator
The Ichimoku Cloud is a comprehensive technical analysis system developed by Japanese journalist Goichi Hosoda
Chaikin Money Flow
Chaikin money flow's primary purpose is to distinguish between periods of accumulation and distribution of a security.
cBot
Grid
Martingale
Investion Basic
This is a basic martingale bot without an indicator. For long and short trading options at the same bot.
You may also like
Indicator
NAS100
Indices
XAUUSD
+4
Automatically calculates the previous day’s high and low, determines the range, and then projects Fibonacci levels.
Indicator
Indices
Stocks
Forex
+1
An indicator that accurately shows the trend direction. A vital tool for clear trading decisions.
A compact, visual multi-timeframe trend indicator for cTrader. Easily spot bullish or bearish trends across 4 customizab
Indicator
Stocks
Forex
Signal
+1
Engulfing Pattern Indicator
Indicator
NAS100
Indices
XAUUSD
+6
NewsGuard High-Impact News Risk Overlay
Visual warning zones for high-impact news so you can manage risk before volatility hits.
Indicator
XAUUSD
Forex
EURUSD
+2
ALMA Smoothed Gaussian Moving Average
ALMA Smoothed Gaussian Moving Average (ASGMA) – by LudwigICT
Indicator
NAS100
NZDUSD
XAUUSD
+10
Atlas Seasonal Returns Heatmap
🧭 See when your market tends to move—by Month, Day-of-Week, or Hour-of-Day🧭
Indicator
Grid
NAS100
NZDUSD
+15
With this Fibonacci retracement indicator, traders have full control over the retracement levels displayed on the chart.
Overlay higher-timeframe SuperTrend to filter noise, follow real trends, and avoid lower-timeframe whipsaws. As
Indicator
Scalping
Nadaraya-Watson Kernel Regression
Ultra-smooth adaptive trend line via Gaussian kernel regression — low lag, clean structure.
Indicator
Indices
Prop
Stocks
+3
Price Action Zone shows previous D/W/M key levels to help frame intraday price action, liquidity, and market structure.
Volume for Renko/Range