Quantitative Qualitative Estimation
"Quantitative Qualitative Estimation" logo
5.0
03/09/2025
125
Desktop
Since 03/10/2024
Sales
1
Free installs
5082
"Quantitative Qualitative Estimation" uploaded image"Quantitative Qualitative Estimation" uploaded image"Quantitative Qualitative Estimation" uploaded image

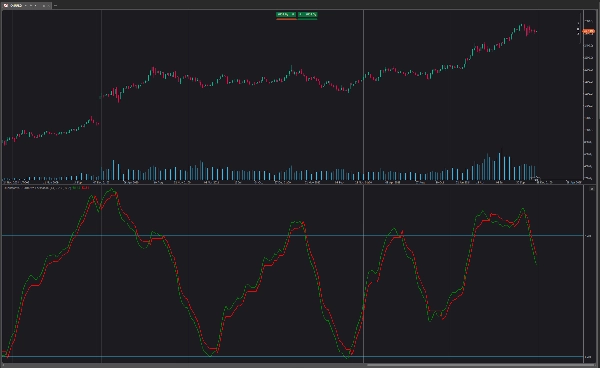
The QQE (Quantitative Qualitative Estimation) Weighted Oscillator improves on its original version by weighting the RSI based on the indications given by the trailing stop, requiring more effort in order for a cross with the trailing stop to occur. The QQE Weighted Oscillator is comprised of a smoothed RSI oscillator and a trailing stop derived from this same RSI.

The oscillator can be used to indicate whether the market is overbought/oversold as well as an early indication of trend reversals thanks to the leading nature of the RSI.

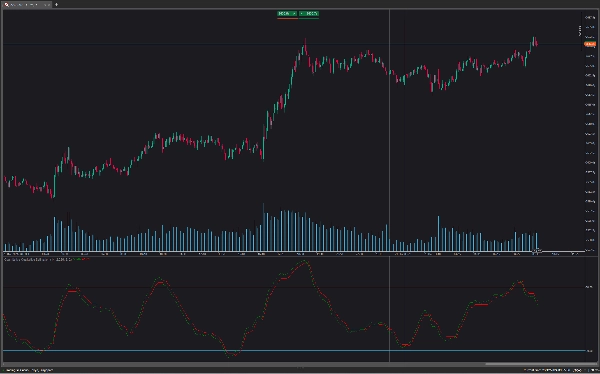
Using higher Factor values will return a longer-term trailing stop.

Like with a regular RSI divergence can be indicative of a reversal.

Further weighting will control how much "effort" is required for the trailing stop to cross the RSI. For example. For example, an RSI above the trailing stop will require a higher degree of negative price variations in order for a potential cross to occur when using higher weights.


This can cause higher weightings to return more cyclical and smoother results.
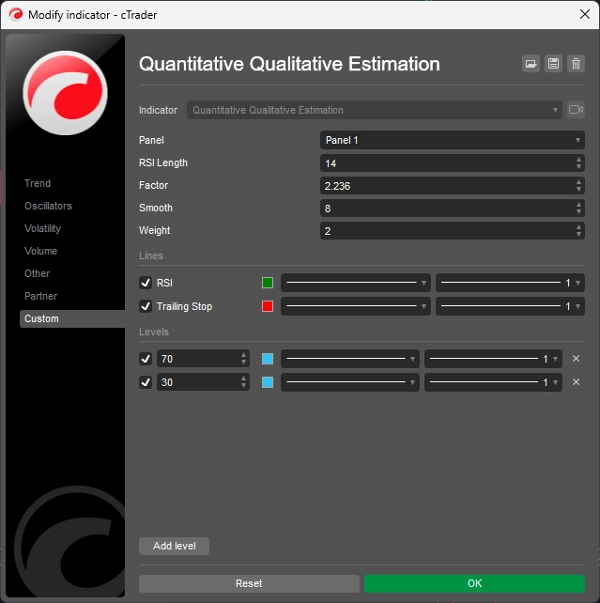
How to change settings:

  • Length: Length of the RSI oscillator.
  • Factor: Multiplicative factor used for the trailing stop calculation.
  • Smooth: Degree of smoothness of the RSI oscillator.
  • Weight: Degree of weighting used for the RSI calculation.
More from this author
Top-rated
Free
Indicator
ATR
Supertrend
PMAX
It's a combination of two trailing stop loss and the other one is well-known ATR-based SuperTrend.
cBot
VWAP
RSI
Breakout
+5
Investion X V1.9 - Intelligent Filter-Based Trading System
Trading system combining martingale strategy with multi-layered technical analysis and comprehensive protection features
MultiTimeFrame Moving Averages
3 moving averages with different periods and different time frames.
Indicator
Indices
AI
Machine Learning Momentum Index
The Machine Learning Momentum Index (MLMI) represents the next step in oscillator trading.
Indicator
RSI
Indices
StochasticRSI
Stochastic RSI (StochRSI) is a technical indicator used to measure the strength and weakness of the RSI.
Laguerre RSI
Laguerre RSI is based on John EHLERS' Laguerre Filter to avoid the noise of RSI.
KDJ
The KDJ oscillator display consists of 3 lines (K, D and J - hence the name of the display) and 2 levels.
Indicator
Breakout
Forex
On Balance Volume
On Balance Volume (OBV) measures buying and selling pressure as a cumulative indicator.
Chaikin Money Flow
Chaikin money flow's primary purpose is to distinguish between periods of accumulation and distribution of a security.
Indicator
Breakout
Stocks
Signal
Darvas Box
The Darvas Box involves identifying "boxes" or trading ranges where a stock's price consolidates before breaking out.
Indicator
Indices
Breakout
Stocks
+3
Ichimoku Cloud Indicator
The Ichimoku Cloud is a comprehensive technical analysis system developed by Japanese journalist Goichi Hosoda
cBot
Grid
Martingale
Investion Basic
This is a basic martingale bot without an indicator. For long and short trading options at the same bot.
You may also like
Indicator
NAS100
NZDUSD
Martingale
+24
LookPosOrderIndicator
On-chart draggable panel to show/hide Positions & Pending Orders with fixed warning banner and inline alerts per symbol.
Head Shoulders Finder
Detects Head & Shoulders patterns, plots signals, and alerts for trading opportunities.
Indicator
Signal
Hammer Pattern Indicator
Reversal Probability Engine
Detecting reversal zones + multidimensional mapping of support and resistance "Golden Levels.
SmartBot-MCDX Indicator
MCDX is a powerful and innovative indicator.
Rsi Scalp Indi
RSI Scalper delivers split‑second entries on volatile assets.
Volume-Powered Market Flow Projector
Project market behavior by integrating price and volume data across multiple time dimensions
E7 Polynomial Regression Channel
Polynomial Regression Channel which also reflects the volatility of the underlying asset.
PVA Volume+Analysis_noSourceCode
PVA Volume Analysis Indicator:Price volume over trend strength and direction
SmartFibonacci
SmartFibonacci — automatic Fibonacci retracements & extensions with swing detection, alerts and clean labels for cTrader
KANDIKA HEAT MAP
Color-Based Market Pressure & Volatility Visualizer The Kandika Heatmap Indicator
Indicator
NAS100
Indices
Breakout
+9
WyckoffSimple
📊 🚀 “Anticipate the Market with Wyckoff Smart Zones – Discover Where Institutions Buy and Sell”
SuperEmaColorRSI
This is a super indicator that integrates the RSI indicator with a dual moving average system.
Smart Floating Risk Pro
📊 Smart Floating Risk Pro – Advanced Risk Management for cTrader
Indicator
Indices
Prop
Commodities
+3
OBScope
A cutting-edge indicator designed to detect and visualize high-probability zones based on swing highs, swing lows.
Indicator
Indices
Forex
EURUSD
+1
DXY w HMA
DXY HMA Indicator
Indicator
NAS100
NZDUSD
Martingale
+22
Zigzag Trend
The ZigZag Trend is a market structure tool that filters out small price fluctuations and highlights major swing.
TraderMaxBBflterXDemo-
TraderMax BB Filter X (DEMO) for cTrader 🧪 Limited-Time Demo Version (24h) TraderMax BB Filter X (DEMO) is a precision