"Hurst  HCCO  -  advanced" logo
Indicator
Version 1.0, Mar 2026
Windows, Mac
"Hurst  HCCO  -  advanced" uploaded image
20
Sales
554
Free installs

Hurst Cycle Channel Oscillator Advanced — Indicator Description

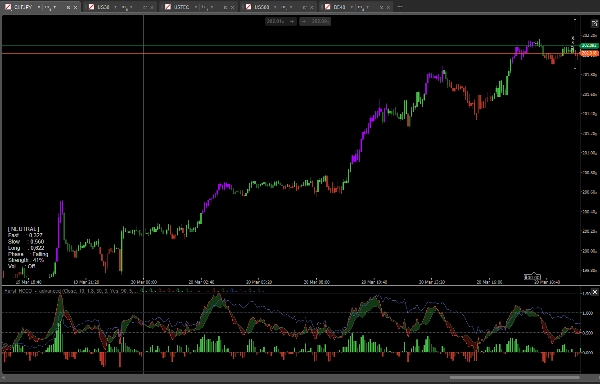
Hurst Cycle Channel Oscillator Advanced is a professional multi-cycle momentum indicator for cTrader based on the principles of Hurst cycle theory. Instead of measuring raw price momentum, it positions the current price within dynamically calculated cycle channels, giving traders a normalized view of where price stands within its natural cyclical movement.


Three Cycle Layers

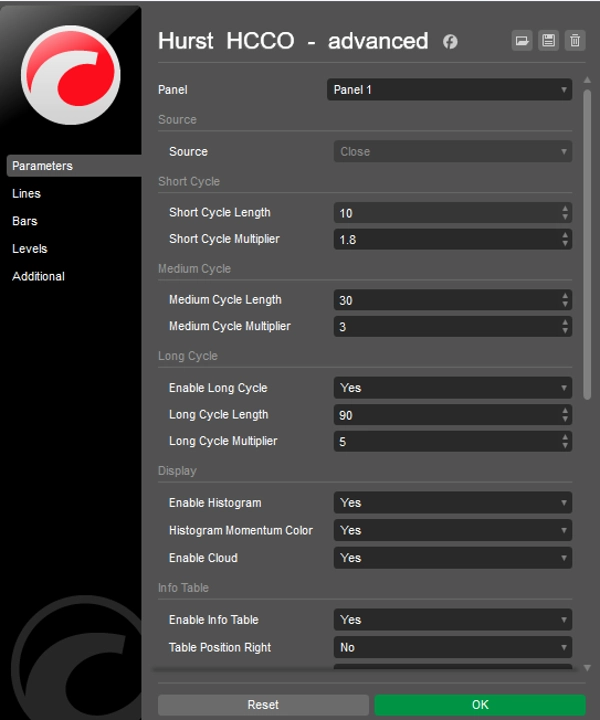
The indicator calculates three independent cycle channels — Short, Medium, and Long — each built from an exponential moving average centered within an ATR-based envelope. The Short and Medium cycles drive the main oscillator, while the optional Long cycle provides a broader market context. All cycle lengths and their ATR multipliers are fully configurable.


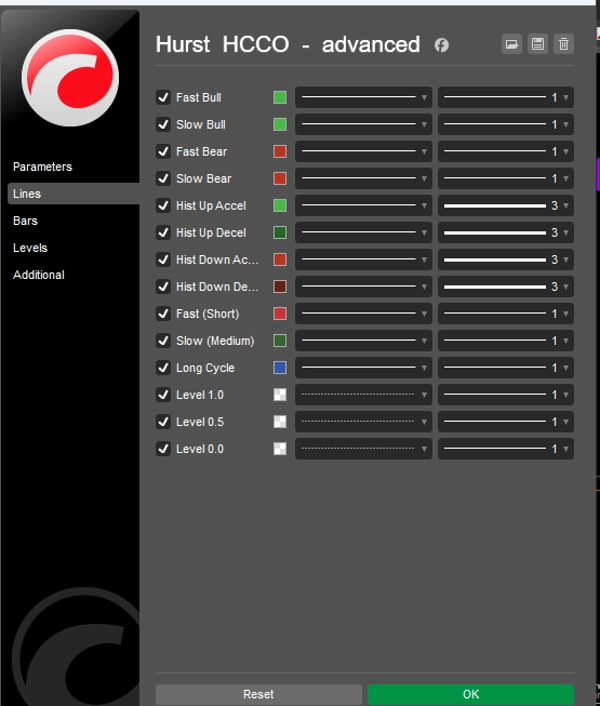
Fast and Slow Oscillator Lines

The Fast line shows where the current price sits within the Medium cycle channel — a value above 0.5 means price is in the upper half of its cycle, below 0.5 means the lower half. The Slow line represents the midpoint of the Short cycle channel relative to the Medium cycle, acting as a smoother reference. Together they create a dual-line oscillator similar in structure to MACD but grounded in cycle geometry.


Cycle Cloud

An optional cloud fills the area between the Fast and Slow lines. A green cloud forms when Fast is above Slow (bullish cycle bias), a red cloud when Fast is below Slow (bearish cycle bias). The cloud makes the relationship between the two cycle layers instantly readable.


Momentum Histogram

The histogram plots the difference between Fast and Slow lines with four-color momentum coding — bullish accelerating, bullish decelerating, bearish accelerating, bearish decelerating. This makes it easy to see not just direction but whether the cycle move is gaining or losing energy.


Cycle Phase Detection

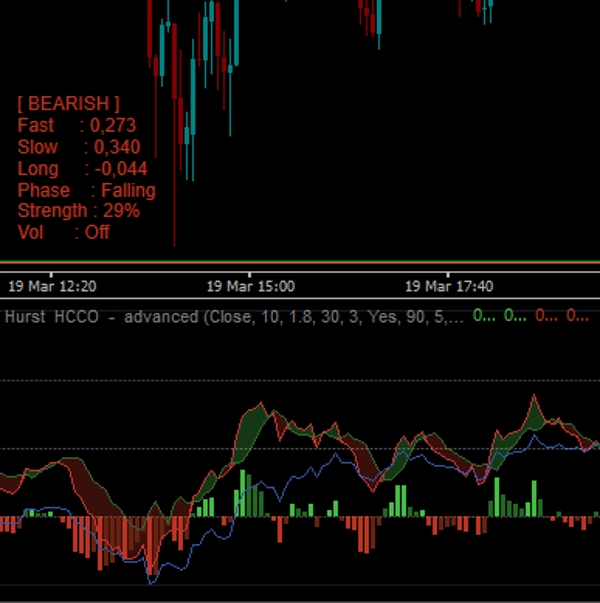
The info table displays the current phase of the cycle: Bottom, Pre-Bottom, Recovering, Rising, Weakening, Post-Peak, Peak. This labeling is derived directly from the Fast oscillator value and its direction, giving traders a plain-language read of where the market is in its cycle.


Trend Strength

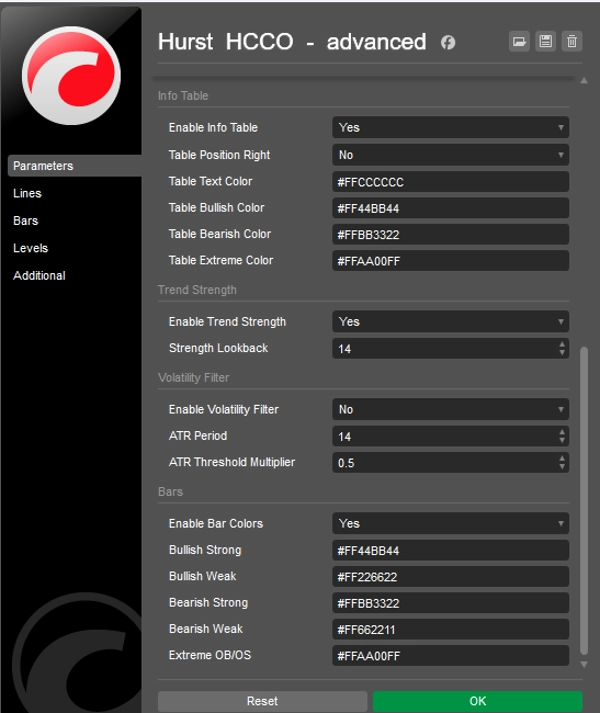
A configurable lookback calculates a normalized trend strength score based on how far the Fast line deviates from the 0.5 midpoint. The result is shown as a percentage in the info table.


Volatility Filter

An optional ATR-based volatility filter greys out histogram bars and bar colors when market volatility falls below a configurable threshold, preventing the oscillator from generating misleading signals during flat or choppy conditions.
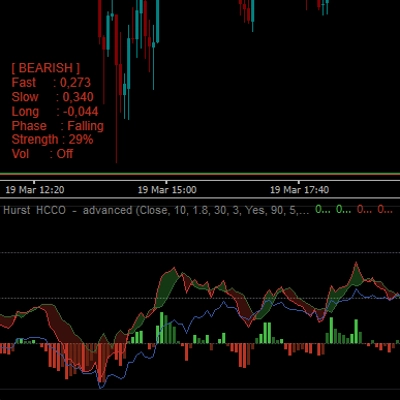

Info Table

A compact on-chart table shows the current market state (Bullish, Bearish, Neutral, Extreme), Fast, Slow and Long oscillator values, cycle phase, trend strength percentage, and volatility filter status. Position and all colors are configurable.


Bar Coloring

When enabled, chart candles are colored based on the oscillator state — strong bullish, weak bullish, weak bearish, strong bearish, and extreme overbought/oversold. Extreme readings occur when the Fast line moves outside the 0.0–1.0 range, signaling a price breakout beyond the cycle channel.


Key Features Summary

  • Three configurable cycle layers based on Hurst cycle theory
  • Dual Fast/Slow oscillator normalized to cycle channel position
  • Cycle cloud between Fast and Slow lines
  • Four-color momentum histogram
  • Automatic cycle phase detection with plain-language labels
  • Real-time trend strength percentage
  • ATR-based volatility filter
  • On-chart info table with full market state breakdown
  • Optional candle coloring
  • All colors fully customizable with alpha channel support
  • No repainting
Indicator profile
0.0
Reviews: 0
Customer reviews
No reviews for this product yet. Already tried it? Be the first to tell others!
BTCUSD
Forex
Signal
Indices
EURUSD
Commodities
GBPUSD
NZDUSD
Prop
Crypto
Stocks
AI
XAUUSD
NAS100
USDJPY
Products available through cTrader Store, including trading bots, indicators and plugins, are provided by third-party developers and made available for informational and technical access purposes only. cTrader Store is not a broker and does not provide investment advice, personal recommendations or any guarantee of future performance.

More from this author

Indicator
AI
Prop
+8
The EMA Trend Simple is a trend-following tool designed for simplicity and visual clarity.
Indicator
ATR
MACD
+15
MACD Advanced -- It combines the standard MACD logic with a rich set of visual tools
Indicator
AI
Grid
+7
Follow The Trend cBot - INDICATOR - displays two Moving Average Bands for cBot or for your own use
Indicator
AI
SMC
+7
The ultimate tool for Price Action and ICT. High, Low and Mid levels for days, weeks Inc. NY Midnight and Custom Range.
Indicator
ATR
Prop
+13
HCCC MTF (Hurst Cycle Composite Channel), Designed for Semi-Automated Trading, Interactive MTF Dashboard
Indicator
AI
RSI
+7
EMA MTF TREND PRO - Multi-timeframe trend analysis overlay indicator, 6 timeframes - in one table with ADX
Indicator
ATR
Channel
+1
Bollinger Bands Advanced Squeeze & Breakout System, Real-Time On-Chart Dashboard, Auto-Squeeze Detector, Dual-Band Cloud
Indicator
AI
SMC
+4
Weekly Daily Opening Gaps — NWOG & NDOG Indicator Professional-grade opening gap visualization for institutional traders
Indicator
AI
Prop
+7
EMA Clouds, Multi-Timeframe (MTF) Overlay, Swing High/Low detection, and a smart Dashboard with neutral zone filtering.
cBot
ATR
EMA
+5
FOLLOW THE TREND XAU EDITION v3.0, Start with $500, AI features BE & TP50%, cbot management simplified
36.2%
ROI
5.09
Profit factor
3.25%
Max drawdown
Indicator
AI
ATR
+12
The standard Relative Strength Index (RSI), RSI & Signal Cloud, Smart Volatility Filter (ATR), On-Chart Info Dashboard
Indicator
SMC
Prop
+11
Sessions PRO is a professional session visualization indicator - 4 Fully Customizable Sessions

You may also like

Indicator
EMA
VWAP
+2
ORB Range Indicator maps the opening range and gives a practical session-breakout workflow with clear labels.
Indicator
VWAP
Volume
+2
VWAP Bands and Swing Wick Structure Indicator
Indicator
Imbalance
Inside Bar
+3
A clean and powerful Smart Money Concepts tool combining Fair Value Gaps, Previous Daily High/Low, Inside/Outside bar
Indicator
Boost your trading with Candlestick Patterns for cTrader – auto-detect key signals for smarter, faster decisions!
Indicator
ATR
Support & Resistance
Price information (D/W/M range) + ATR + swap calculator with triple swap detection. Price GPS.
Indicator
Highlights market sessions & overlaps with real-time range & volume stats – perfect for pro scalpers.
Indicator
BB Breakout Oscillator with alerts! Spot trend reversals using Bollinger Bands. Bullish/Bearish crossovers Alerts.
Indicator
AI
Prop
+9
Phoenix Zones - Detector de Reversiones Críticas
Indicator
Prop
Forex
+13
🎯Automatically detects and visualizes classical chart patterns using multi-timeframe swing point analysis.
Indicator
ATR
Prop
Outside Candle Detector: Highlights major candles/zones with ATR filter & pattern labels. By Avydel Talbo, prop trader.
Indicator
Forex
BTCUSD
+7
🚀 TMAX RBA Indicator - The Ultimate Multi-Timeframe Momentum System 🚀
Indicator
Plot higher-timeframe Bollinger Bands for clearer structure, pullback zones, and breakout signals—without switching char
Indicator
Prop
Scalping
Shows bars from different Time Frame on zoom out and hides the current bars. Perfect tool for Multi TF "Market Reply"
Indicator
CHOCH
Key Levels
+5
ZigZag Market Structure Identifier - Multi-Layer Scanner: Convergent Pivot Detection, 4-TF Overlay & Naked Chart Mode.
Indicator
ATR
Forex
+8
High-Tech 3-Level Squeeze Detection with HTF Filter, Carter Entry/Exit Rules, Signal Quality Grading & Real-Time
Indicator
Forex
BTCUSD
+4
The Linear Regression Oscillator (LRO) is a technical indicator based on linear regression analysis.
Indicator
SMC
Forex
+1
Visualize Asia session range with customizable lines for high, low, mid, start, and end.
Indicator
Prop
Forex
+6
Elliott Wave Structure Pro v2.0 (Non-Repainting) Structure, Elliott, Continuation Entries
20
Sales
554
Free installs