Brokers & props
For business
00
Days
:
00
Hours
:
00
Minutes
:
00
Seconds
ZigZag Price Liquidity Projection
"ZigZag Price Liquidity Projection" logo
Since 03/10/2024
Sales
119
Free installs
21738
"ZigZag Price Liquidity Projection" uploaded image"ZigZag Price Liquidity Projection" uploaded image"ZigZag Price Liquidity Projection" uploaded image"ZigZag Price Liquidity Projection" uploaded image"ZigZag Price Liquidity Projection" uploaded image

Pinescriptlabs Store indicators:                        Pinescriptlabs  Store cBots :  (cBot) Gold & BTC BreakoutSession Pivots(new)

PRICE ACTION  (New)

Trailing Smart Algorithm (new)

S&R Structural ZigZag                                

ZigZag

 BOS & CHOCH

Zones Supply Demand

Leverage Liquidation Map

Auto-Trend Channel


Volume POC Heatmap


PREMIUM SSL CHANNEL

Prediction Based on Linreg & ATR

 ICT Power of 3 
                                                   

SmartTrend Support &
Resistance
Lines
       

Fair Value Gap Sessions                


RSI Trend Trigger

Channel Breakout System

Supertrend

Market Imbalance

Adaptive Trend Channel 

Dynamic
Market Structure
Analysis
of
Turning
Points

Order Block

Fibonacci
Linear
Regression
Multi-timeframe

Dynamic RSI

Momentum Fair Value Gap

Market Flow Projection

Dynamic Trend Gradient

Multi-Level
Candle Bias
Tracker

Zig-Zag Extremity Tracker

Reactive Moving Average

Auto
Support and
Resistance
Trend
Lines

All
Support and
Resistance
Levels

Dynamic Range Momentum


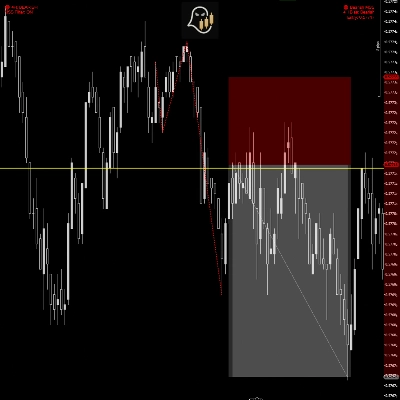
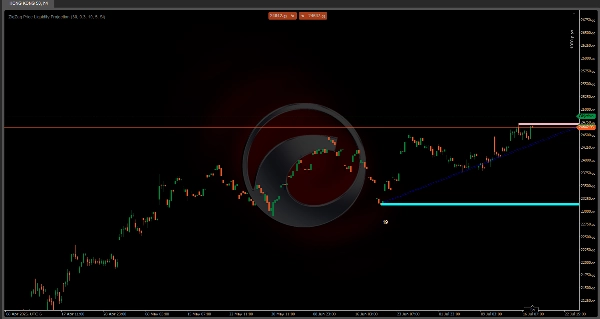
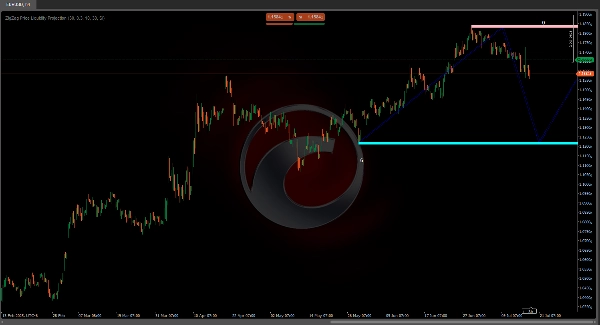
📊 ZigZag Price Liquidity Projection Indicator
"See where the market might turn before it happens!" 🔮

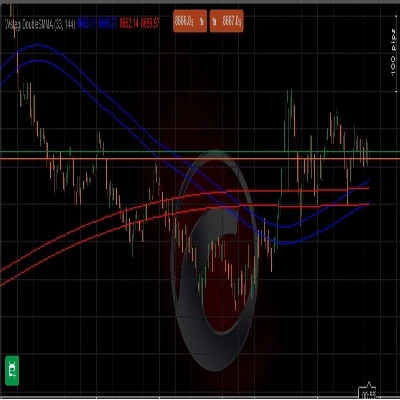
This indicator identifies key support/resistance levels 🛑 and predicts liquidity zones 💧 on your chart using:

  • 🔍 Pivot Points: Detects significant highs and lows
  • 📈 ATR Volatility: Measures price fluctuations for precision tuning
  • 💦 Liquidity Projections: Anticipates high-activity areas (buy/sell clusters) through zigzag patterns

🎯 Purpose: Predicts price reaction zones (bounces/breakouts/consolidations) to improve entry/exit decisions

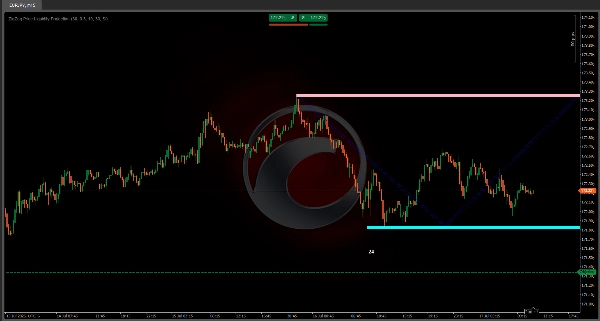
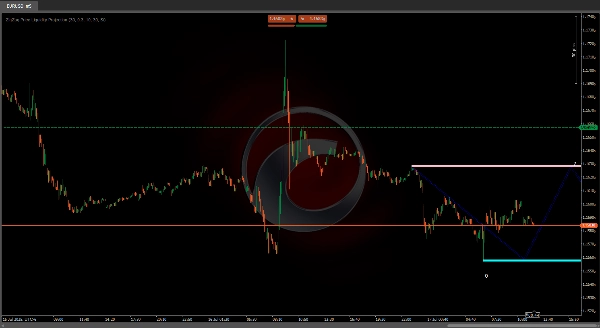
✨ The Zigzag Advantage
These connected lines act like a treasure map 🗺️ showing:
1️⃣ Future price paths within defined ranges
2️⃣ Potential reversal zones where price might stall or reverse
3️⃣ Visual reference points for trade planning

🚦 Key Features:

  • 📅 Early warning system for important levels
  • 🎯 Projects future moves based on pivot structures (bullish/bearish paths)
  • 🔢 Touch counters (e.g., "24" = 24 historical tests at that level)

⚙️ Recommended Settings

SettingValueEffect

ATR Period

30

🎚️ Volatility sensitivity

Pivot Period

30

🔍 Pivot significance range

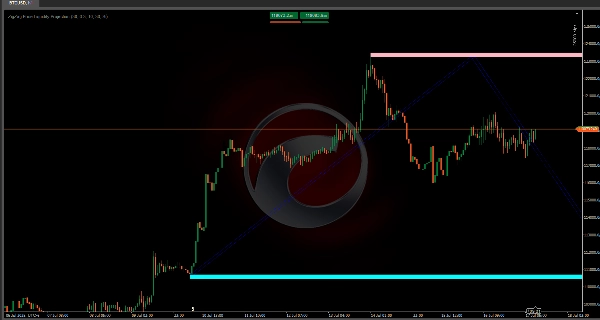
⏳ Best Timeframes: 15min - 4hr charts ⏱️

💡 Pro Tip:
"Combine with candlestick patterns 🕯️ for confirmation! The zigzag shows WHERE price might go, candles show WHEN it's happening."

🎯 Final Takeaway:
A powerful all-in-one visual tool for spotting:
✅ Liquidity zones 💦
✅ Critical levels 🎯
✅ Future price paths 🚀

Perfect for intraday traders who want to anticipate moves rather than chase them! 🏃💨

0.0
Reviews: 0
Customer reviews
No reviews for this product yet. Already tried it? Be the first to tell others!
More from this author
Indicator
RSI
Breakout
XAUUSD
+6
ZigZag
ZigZag filters noise, spots trends, patterns, pivots, aiding analysis, trade management, and confirmations. 📉📈
Indicator
RSI
Breakout
XAUUSD
+6
Order Block
Identify bullish and bearish Order Blocks to spot key support/resistance levels and potential trend reversals! 📈🔄
Indicator
RSI
Breakout
XAUUSD
+5
Auto-Trend Channel
Adaptive trend channel using linear regression and Pearson correlation for dynamic support, resistance, and trends.
Indicator
RSI
XAUUSD
Breakout
+5
BOS & CHOCH
Market structural patterns , specifically the concepts of Change of Character (ChoCH) 🔄 and Break of Structure (BoS) 💥
Indicator
RSI
Breakout
XAUUSD
+6
Volume POC Heatmap
📊 Shows volume by price levels, highlights POC, and key zones. Identifies dynamic support/resistance and imbalances.
Indicator
RSI
Breakout
Supertrend
All Support and Resistance Levels
"Identify key market zones and visualize support/resistance from multiple timeframes on a single chart.
Indicator
RSI
Breakout
XAUUSD
+5
Zones Supply Demand
📊Zones Supply & Demand: Identifies key price levels with high volume concentration, marking Supply/Demand Zones & Marke
Indicator
RSI
Breakout
XAUUSD
+5
Supertrend
💹 Define a price channel 📈 and determine trend direction (bullish 🟢 or bearish 🔴).
Indicator
RSI
Breakout
XAUUSD
+6
Fair Value Gap Sessions
identify and highlight temporary market inefficiencies known as "fair value gaps" 🚨 within specific trading Sessions.
Indicator
RSI
Breakout
XAUUSD
+4
Dynamic Market Structure Analysis of Turning Points
Identify market structure effortlessly with swing highs, lows, CHoCH, and BOS levels for smart trading decisions! 📊🔍"
Indicator
Indices
RSI
XAUUSD
+7
RSI Divergence
Detects bullish and bearish divergences
Indicator
RSI
Breakout
Supertrend
Trend Heikin Multi MA
🚀 TrendHeikinMultiMA: Advanced trend detection using Heikin-Ashi smoothing & MAs! Eliminates noise, confirms real trend
Indicator
RSI
Breakout
XAUUSD
+4
Multi-Level Candle Bias Tracker
Price direction by calculating the probability of reaching new highs/lows. Shows levels & stats📈
Advanced Market Structure Bos,Choch,SwinLevels, Order Blog
Advanced price action tool that combines multiple technical analysis concepts
Indicator
RSI
Breakout
Supertrend
Market Trend OB
Price action to detect when the market changes trend (MSB) and defines, order blocks , ZigZag etc.📊
Indicator
RSI
Breakout
Supertrend
Leverage Liquidation Map
📊 Liquidation Map: Potential areas where highly leveraged investors might face liquidations.
Indicator
RSI
Breakout
Supertrend
Swing Levels
🔍 Automatically detect support and resistance levels based on "swings" or pivots
Indicator
RSI
Breakout
Supertrend
Zig-Zag Extremity Tracker
Dynamically adjusts regression channels based on ZigZag extremes, resetting when price breaks bands to track real trends
You may also like
Indicator
Indices
RSI
Breakout
+8
RSI Trend Trigger
RSI Trend Trigger 📈: Uses dual-layer RSI to spot trends & generate clear buy/sell signals.
Indicator
NAS100
Indices
Prop
+6
VolumeThermometer
Heatmap of intra-HTF volume (POC/VA) built from LTF tick data; paints current candle and auto-loads visible history.
Indicator
NZDUSD
Forex
EURUSD
+2
4 RCS Relative Strength w Alerts_NSC
Forex Strength Meter for cTrader: 4 custom currencies, cross alerts, visual arrows. Trade smarter!
Market BIAS Detector
The Market BIAS Detector is a smart trading assistant designed to identify the market.
Top-rated
Free
VWAP Pro
Advanced VWAP with up to 30 anchored levels, multiple timeframes, memory mode, standard deviation bands & simple GUI
ReversalGuard
ReversalGuard Pro: Domina el Mercado con Zonas de Soporte y Resistencia de Alta Precisión"
Indicator
RSI
Breakout
XAUUSD
+13
Fear & Greed Index
Fear & Greed Index: 4 configurable components (momentum, volatility, strength, pattern) with 6 calculation methods each
Indicator
Grid
XAUUSD
Commodities
+5
Trend Scope pro
Trend Scope Pro – Smarter Trend Analysis with Linear Regression Channels
Indicator
Forex
Signal
MACD
swingh6
Swing-Trading Indicaotr for pairs like EUR/USD, AUD/USD, and USD/JPY. Most effective on higher time frames H4,H6,H12...
Indicator
Breakout
Forex
Pivot Point Daily Indicator
Pivot Points Standard — All-in-One Multi-Timeframe Pivot Indicator for cTrader
Indicator
Scalping
Kaufman Adaptive MA with Trend Vision
Adaptive KAMA: fast in trend, slow in noise — with color-coded market state visualization.
Order Block detector PRO
Order Block PRO — Smart Institutional Zone Detector
Indicator
Stocks
Commodities
Forex
buy sell
SmartSignal Pro: Precise BUY/SELL signals to profit in any market. Trade like a pro! 🚀
Indicator
Indices
Stocks
Commodities
+2
Series - FXMaster
Consecutive Series Moves — Reveal the True Pulse of Price Action
Indicator
NAS100
NZDUSD
XAUUSD
+12
Volume Meter
Volume Meter
Indicator
NAS100
Breakout
XAUUSD
+12
SigmaTrend Oscillator
SigmaTrend Oscillator is an advanced momentum-based trend identification tool that combines dynamic price
Indicator
Indices
Stocks
Commodities
+2
Market Sessions - Free
Track major trading sessions (Tokyo, London, New York) with customizable colors and visual sessions on your chart.
Indicator
NAS100
NZDUSD
RSI
+13
Multi Timeframe Trend Scanner
Multi Timeframe Trend Scanner 🔍 EMA+RSI+ATR heatmap with clear BUY/SELL bias from M5 up to D1.