Description
Delta Volume Indicator - Advanced Order Flow Analysis for cTrader
The Delta Volume Indicator analyzes tick-by-tick order flow to reveal buying and selling pressure that price action alone cannot show. It calculates the difference between upticks (buys) and downticks (sells) for each bar, providing insights into true market participation.
Version 1.0
Currently Stable Version for Lower timefrmes ( 1m - 15m )
Upcoming Updates Soon!
What Makes It Unique
True Tick-Level Analysis: Not volume approximation - actual tick classification
Dual Divergence Systems: Both bar-level and fractal-based divergence detection
Quality Validation: Corwin-Schultz spread estimation ensures reliable signals
Flexible Visualization: Multiple coloring methods and filtering options
Complete Customization: Every color, threshold, and display option configurable
Research-Based: Built on peer-reviewed market microstructure research
------------------------------------------------------------------------------------------------------------------------------------------------------------
Core Features
------------------------------------------------------------------------------------------------------------------------------------------------------------
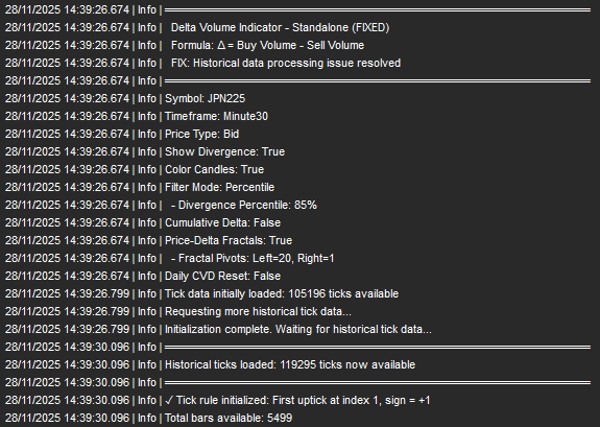
Delta Volume Calculation
- Tick Rule Classification: Every tick classified as buy (+1), sell (-1), or neutral (0)
- Bar Delta: Net buying/selling pressure per bar = Buy Volume - Sell Volume
- Cumulative Delta: Running sum showing persistent directional pressure
- Multiple Price Types: Calculate using Bid, Ask, or Mid prices
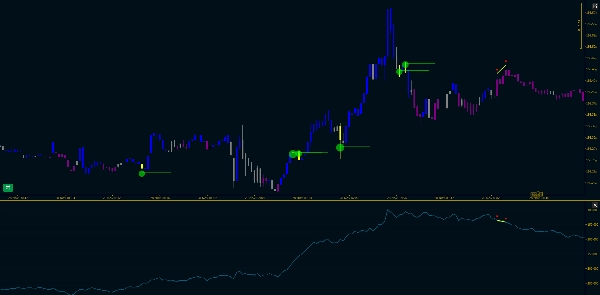
Delta Divergence Detection
Identifies when price and order flow disagree - a potential reversal signal.
Two Filter Methods:
- Magnitude + Imbalance: Direct thresholds for delta strength and volume imbalance
- Percentile-Based: Adaptive filtering based on historical distribution
Visual Markers:
- Automatically placed at Point of Control (highest volume price level)
- Size scales with delta magnitude
- Optional trendlines extending forward
Chart Candle Coloring
Color candles by order flow with three priority levels:
- Divergence (Yellow) - highest priority
- CVD Regime (optional) - stable regime identification
- Bar Delta (Lime/Red/Gray) - bar-by-bar coloring
------------------------------------------------------------------------------------------------------------------------------------------------------------
CVD Regime Analysis
------------------------------------------------------------------------------------------------------------------------------------------------------------
Two Methods for Stable Coloring:
1. Position In Range
- Shows where CVD sits in recent range (0-100%)
- Upper 30% = Bullish | Lower 30% = Bearish | Middle 40% = Neutral
- Fast, intuitive, self-adaptive
2. Corwin-Schultz Quality Filter
- Uses actual Corwin-Schultz spread estimation on price
- Only trusts CVD when market liquidity is high (spread is tight)
- Automatically filters unreliable periods
- Based on peer-reviewed research (Corwin & Schultz 2012)
Key Principle: CVD is only meaningful in liquid markets. This method validates market quality before displaying CVD signals.
------------------------------------------------------------------------------------------------------------------------------------------------------------
Price-Delta Fractal Analysis
------------------------------------------------------------------------------------------------------------------------------------------------------------
Simultaneously tracks pivot points on both price chart and cumulative delta.
Features:
- Detects high/low fractals with configurable pivot lengths
- Sequential tracking: follows consecutive highs or consecutive lows
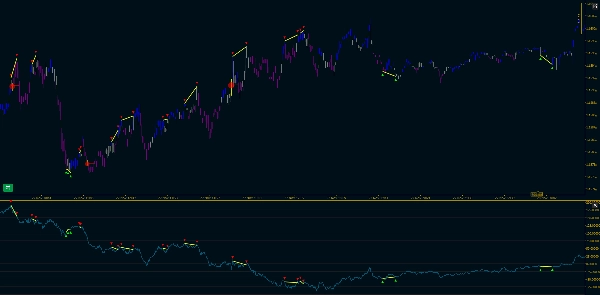
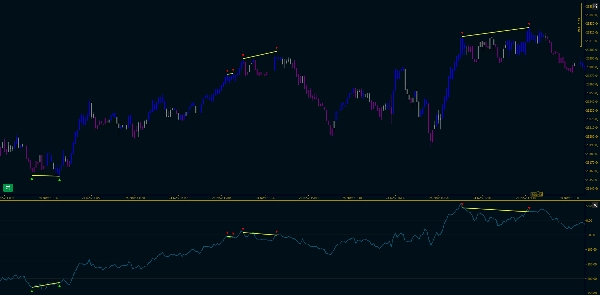
- Divergence detection: compares price slope vs CVD slope between pivots
- Dual visualization: markers and trendlines on both price chart and indicator panel
- Optional Filter: Show only divergent fractals for clean, focused view
------------------------------------------------------------------------------------------------------------------------------------------------------------
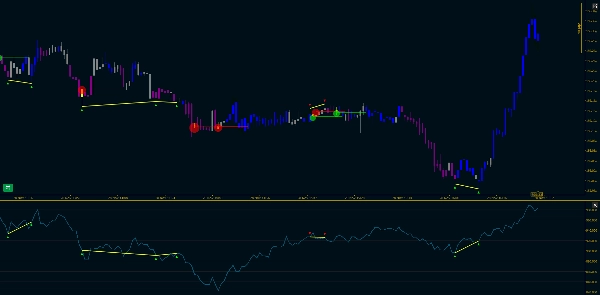
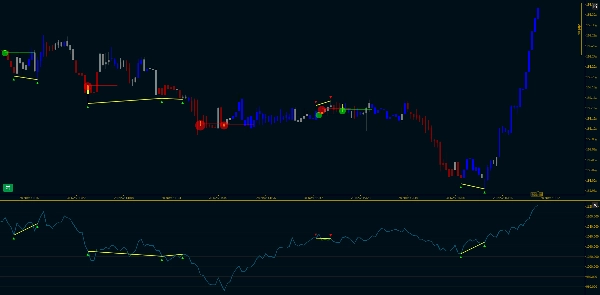
Visual Output
------------------------------------------------------------------------------------------------------------------------------------------------------------
Indicator Panel
- Delta Histogram: White bars (normal), Yellow bars (divergences)
- Cumulative Delta Line: Cyan line showing running order flow
- Zero Reference Line: Gray dotted line
- Fractal Markers: ▼ (highs) and ▲ (lows) with trendlines
Price Chart
- Colored Candles: Visual representation of order flow regime
- Fractal Markers: Synchronized with indicator panel
- Fractal Trendlines: Connecting pivots with divergence highlighting
- Divergence Markers: Circles at Point of Control
------------------------------------------------------------------------------------------------------------------------------------------------------------
References
------------------------------------------------------------------------------------------------------------------------------------------------------------
- Corwin, S. A., & Schultz, P. (2012). "A Simple Way to Estimate Bid-Ask Spreads from Daily High and Low Prices." The Journal of Finance, 67(2), 719-760.
- López de Prado, M. (2018). Advances in Financial Machine Learning, Chapter 19.
- Lee, C. M., & Ready, M. J. (1991). "Inferring Trade Direction from Intraday Data." The Journal of Finance, 46(2), 733-746.


