wt.TiB Utility
Indicator
31 downloads
Version 1.0, Feb 2026
Windows, Mac
4.0
Reviews: 1
"wt.TiB Utility" uploaded image"wt.TiB Utility" uploaded image"wt.TiB Utility" uploaded image"wt.TiB Utility" uploaded image
41.76M
Traded volume
56.66K
Pips won
29
Sales
251
Free installs

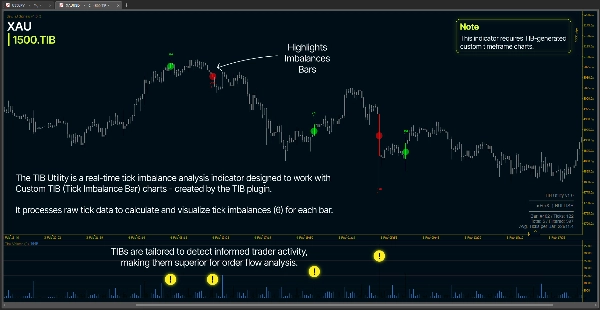
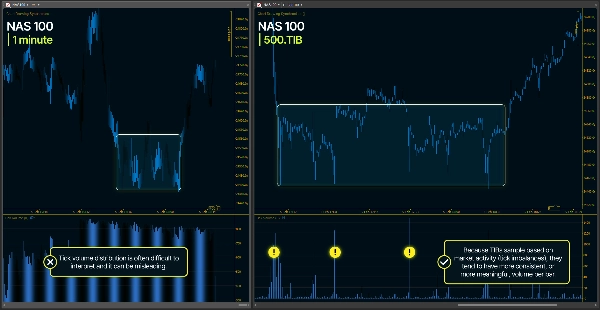
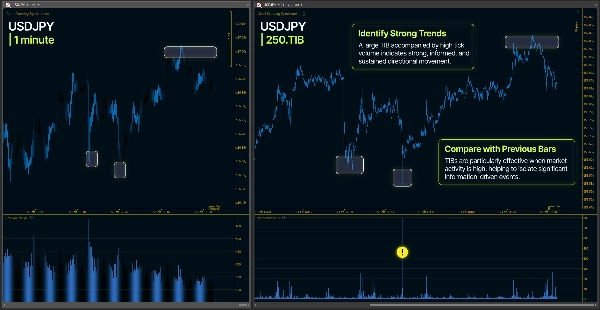
The TIB Utility is a real-time tick imbalance analysis indicator designed to work with custom TIB (Tick Imbalance Bar) charts created by the TIB plugin. It processes raw tick data to calculate and visualize tick imbalances (θ) for each bar.


IMPORTANT NOTES

  • This indicator will work correctly only on charts created with Tick Imbalance Bars Plugin
  • Feel free to contact me for complete use guide related to Plugin and Utility Tool


What It Does

The indicator analyzes each bar by processing individual ticks and applying the tick rule. The cumulative sum of these signed ticks produces θ (theta), the tick imbalance for that bar.


Core Functions

  • Historical Analysis
  • Processes completed bars from tick history
  • Calculates imbalance and tick count for each bar
  • Applies filtering thresholds
  • Draws labels and circles on qualified bars


Live Tracking

  • Monitors developing bar in real-time
  • Updates imbalance as each tick arrives
  • Colors bar based on current imbalance
  • Triggers alerts when thresholds are reached


Visual Feedback

  • Text labels showing imbalance values
  • Colored circles at bar midpoint (size scales with |θ|)
  • Bar coloring (optional)
  • Info panel with live statistics
4.0
Reviews: 1
5
0 %
4
100 %
3
0 %
2
0 %
1
0 %
Customer reviews
February 18, 2026
wt.TiB Utility is a niche but reliable helper tool for traders working with Tick Imbalance Bars. It runs smoothly, handles tick dynamics well and stays lightweight. Best suited for advanced users focused on microstructure trading rather than classic timeframe analysis.
NAS100
NZDUSD
Breakout
XAUUSD
Commodities
Forex
Signal
EURUSD
GBPUSD
BTCUSD
Indices
Prop
Stocks
Crypto
USDJPY

More from this author

Desktop plugin
Indices
XAUUSD
Prop
+8
wt.Custom Timeframe
Build custom second and tick charts using adjustable bar sampling intervals.
cBot
NAS100
Indices
Prop
+9
WT - Hotkeys - Trade Panel
Turn Your Keyboard into a Trading Console — Instant Entries, Exits, and Precision Risk Control.
Indicator
NAS100
NZDUSD
XAUUSD
+11
WT - RR Tool
Lightweight Risk-Reward Visualization Tool.
Indicator
NAS100
NZDUSD
XAUUSD
+12
WT - Amplitude - Momentum Detection
Experience a new approach with amplitude-based momentum analysis. Smart Trend Detection That Adapts to Market Volatility
Desktop plugin
Indices
Commodities
Stocks
wt.Custom Session
Build custom charts based on specific trading sessions.
Indicator
NAS100
NZDUSD
XAUUSD
+12
WT - PJER
Statistical boundaries that adapt to real-time volatility for a better risk management.
Indicator
NAS100
NZDUSD
Breakout
+14
WT - Tick Imbalance Bars
Tick Imbalance Bars Indicator - brings institutional-grade market microstructure analysis to cTrader.
Indicator
NAS100
NZDUSD
XAUUSD
+12
WT - Hawkes Process
Identifies market compression zones and explosive Breakout moments using mathematical modeling.
Indicator
NAS100
Breakout
XAUUSD
+12
WT - Tick Volume Bars
Volume Imbalance Bars Indicator - brings institutional-grade market microstructure analysis to cTrader.
Desktop plugin
NAS100
NZDUSD
Martingale
+26
wt.UNiRENKO
Adaptive Renko chart builder for precise, flexible trading - ideal for both scalping and trend analysis.
Indicator
NAS100
Breakout
XAUUSD
+10
WT - Custom Renko PRO
Universal Renko Overlay. Tick-Accurate Renko Bars Aligned with Futures Contract Specifications.
Desktop plugin
NAS100
NZDUSD
Breakout
+13
wt.Tick Imbalance Bars
This plugin creates bars that reflect actual market activity rather than arbitrary time divisions.

You may also like

Indicator
Grid
NAS100
NZDUSD
+18
Zig Zag ATR
ZigZag Pro — Advanced swing detection with ATR threshold, fractal confirmation, and colored segments. Clean market
Indicator
Indices
Prop
Stocks
+6
New Way Sar - Pro
The Parabolic SAR, or "Stop and Reverse," is a dynamic technical analysis tool.
Indicator
Indices
RSI
ATR
AlgoCorner Crosshair Edge
Pinpoint, highlight and lock market data easily
Indicator
NAS100
Indices
NZDUSD
+7
ICT Killzones & Macros
KILLZONES AND MACRO SESSIONS
HeatMap Candle
HeatMap Candle
Indicator
NAS100
NZDUSD
Breakout
+14
Bollinger Bands Cloud
Visualize Bollinger Bands with a colored cloud for clarity. Enhance your trading precision with this dynamic indicator!
Indicator
Breakout
Waddah Attar Explosion
Combines MACD momentum with Bollinger Bands volatility to identify explosive price breakout moments.
VWAP-Free
VWAP only timeframe
Indicator
NAS100
NZDUSD
XAUUSD
+13
RegressionChannelV2
Regression Channel plots dynamic upper/lower bands around price to highlight trend direction, volatility, and potential
Indicator
NAS100
NZDUSD
XAUUSD
+10
Smart Trend Scanner
Auto-draws filled trendline zones and detects breakouts with alerts.
Indicator
Signal
Scalping
[Stellar Strategies] Linear Regression Candles 1.1
Approach to price analysis by visualizing candlestick data through the lens of linear regression slopes 📈📉
Indicator
Indices
Prop
Commodities
+3
Period Separator
Period Separator that shows on all timeframes including renko and range bars.
41.76M
Traded volume
56.66K
Pips won
29
Sales
251
Free installs