Beschreibung
ÜBERBLICK
Der Balance of Power Indikator misst die Stärke der Käufer gegenüber den Verkäufern, indem er die Fähigkeit jeder Seite bewertet, die Preise auf extreme Niveaus zu treiben.
Eingeführt von Igor Levshin in der August-Ausgabe 2001 der Technical Analysis of Stocks & Commodities Zeitschrift, berechnet BOP das Verhältnis der Kursbewegung innerhalb der Spanne jeder Kerze, um interne Stärke-Dynamiken unabhängig von der Kursrichtung aufzuzeigen.
KONZEPT
Balance of Power misst, wo der Kurs innerhalb der Spanne jeder Kerze schließt, um den internen Kampf zwischen Käufern und Verkäufern zu offenbaren.
Das zugrundeliegende Prinzip ist einfach: Käufer treiben die Preise Richtung Hoch, Verkäufer Richtung Tief. Wo der Kurs letztlich innerhalb dieser Spanne schließt, zeigt, wer die Handelsperiode dominierte.
Die Rohwerte werden mittels gleitendem Durchschnitt geglättet, um Rauschen zu reduzieren und anhaltenden Richtungsdruck zu zeigen, wodurch unregelmäßige Kerzenwerte in ein klares Momentum-Messinstrument verwandelt werden, das Verschiebungen in der Marktbeherrschung verfolgt.
ANWENDUNG DER MARKTSTRUKTUR
BOP liefert eine Analyse der internen Stärke, die die Kursstruktur bestätigen oder widersprechen kann:
Identifikation der Trendphase
- Starker Aufwärtstrend: BOP liegt konstant über Null mit höheren Tiefs
- Starker Abwärtstrend: BOP liegt konstant unter Null mit niedrigeren Hochs
- Konsolidierung: BOP oszilliert um die Nulllinie
- Übergangszonen: BOP durchbricht vorherige Struktur (höheres Hoch/niedrigeres Tief)
Unterstützungs-/Widerstandskonfluenz
- BOP kehrt oft zur Null zurück, wenn der Kurs Schlüsselbereiche testet
- Extreme BOP-Werte (+0,8 bis +1,0 oder -0,8 bis -1,0) können Erschöpfung nahe der Struktur anzeigen
- Divergenz an Strukturleveln deutet auf mögliche Ablehnung oder Durchbruch hin
Distribution/Akkumulation
- Steigende Preise bei fallendem BOP: mögliche Distributionsphase
- Fallende Preise bei steigendem BOP: mögliche Akkumulationsphase
- Diese Divergenzen sind besonders bedeutend nahe großer Strukturlevel
MULTI-TIMEFRAME-STRATEGIE
Die Verwendung von BOP über verschiedene Zeitrahmen bietet Kontext und Präzision:
1. Höherer Zeitrahmen (HTF) - Richtungsbias:
- Täglicher/4H BOP über Null → Kaufgelegenheiten auf niedrigeren Zeitrahmen suchen
- Täglicher/4H BOP unter Null → Verkaufsgelegenheiten auf niedrigeren Zeitrahmen suchen
- HTF BOP kreuzt Null → großer Trendwechsel, auf Bestätigung warten
2. Niedriger Zeitrahmen (LTF) - Einstiegszeitpunkt:
- 1H/15M BOP stimmt mit HTF überein → Setups mit hoher Wahrscheinlichkeit
- LTF BOP/Signal-Kreuzung in HTF-Richtung → Einstiegssignal
- LTF Histogramm-Ausdehnung bestätigt Momentum
3. Zeitrahmen-Ausrichtung:
- Alle Zeitrahmen sind sich einig → Trades mit stärkster Überzeugung
- HTF und LTF divergieren → auf Auflösung warten oder Trade vermeiden
- LTF Umkehr gegen HTF → nur potenzielles Gegen-Trend-Scalping
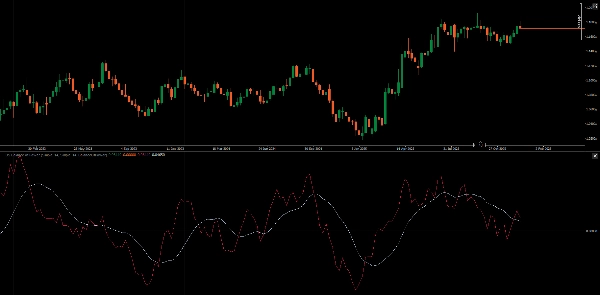
SIGNALLINIE & HISTOGRAMM
Signallinie (GD von BOP):
- BOP/Signal-Kreuzungen liefern gefilterte Ein- und Ausstiegssignale
- Steigung der Signallinie zeigt Momentum-Persistenz an
- Abstand zwischen BOP und Signal zeigt Bewegungsausdehnung
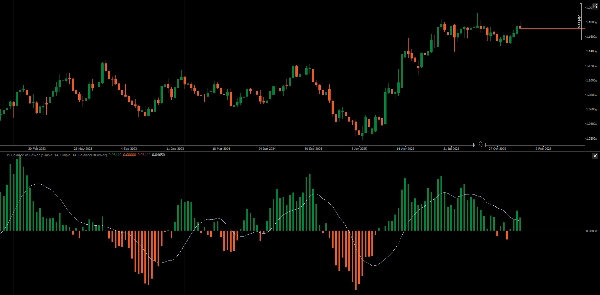
Histogramm-Modi:
- Wertmodus: Zeigt BOP-Polarität relativ zu Null (Käufer-/Verkäuferdominanz)
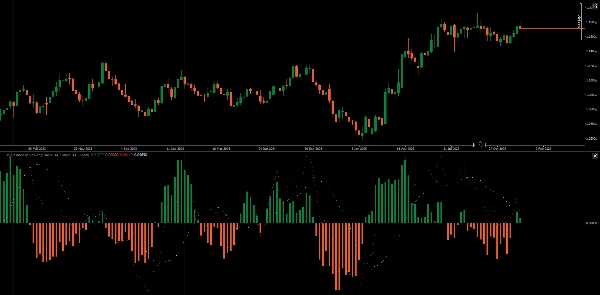
- Signalmodus: Zeigt BOP - Signal Differenz, die Momentumverschiebungen früher als Kreuzungen offenbart
Im Signalmodus treten Histogramm-Nulllinienkreuzungen vor BOP/Signallinienkreuzungen auf und bieten eine Frühwarnung vor Momentumänderungen.
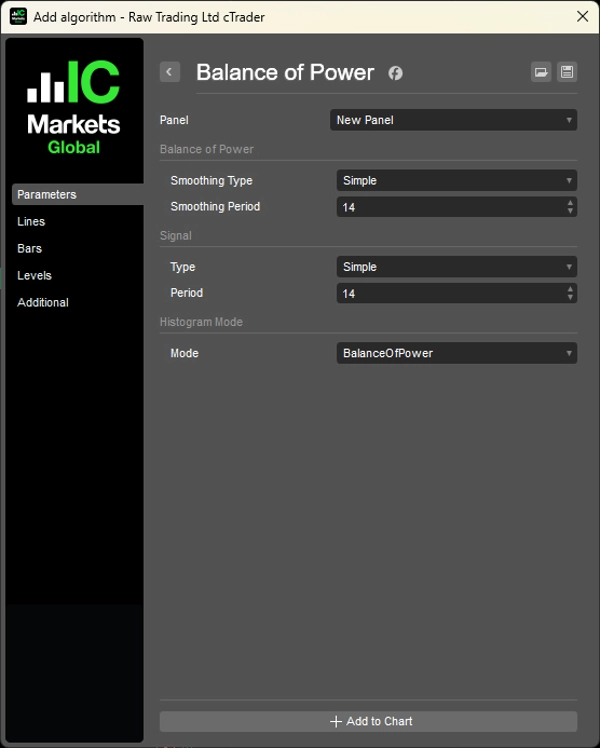
EIGENSCHAFTEN
- Glättungsperiode: Einstellbare GD-Periode für BOP (Standard 14)
- Glättungstyp: Auswahl verschiedener GD-Typen (SMA, EMA, etc.)
- Signalperiode: Einstellbare GD-Periode für Signallinie (Standard 14)
- Signaltyp: Auswahl verschiedener GD-Typen für Signallinie
- Histogramm-Modus: Umschalten zwischen Wert- und Signaldifferenzanzeige
PRAKTISCHES BEISPIEL
- HTF (Täglich): BOP über Null und steigend → bullische Tendenz
- Kurs zieht zum Support zurück
- LTF (1H): BOP kreuzt über Signal → Einstiegssignal
- Histogramm (Signalmodus) weitet sich aus → bestätigt Momentumbeschleunigung
- Ausgang, wenn LTF Histogramm schrumpft oder BOP unter Signal kreuzt
__________________________________________________________________________________________
MEHR KOSTENLOSE INDIKATOREN
Entdecken Sie eine breite Palette von Marktanalysetools – von Struktur und Volumen bis Regression, Volatilität und benutzerdefinierten Zeitrahmen.
Der Quellcode ist auf GitHub Repository verfügbar.
Alle kostenlos nutzbar. Wenn Sie jedoch Kaffee-Unterstützung senden möchten, können Sie dies hier tun.
Unterstützung/Widerstand
Volumen
- Volumen-Aktivitätsprofiler
- Volumeneffizienz-Analysator
- Volumenprofil-Analyse
- Volumenprofil - Aktualisiert
- Volumenstreuungsanalyse
- VWAP (Volumen-Gewichteter Durchschnittspreis)
Gleitende Durchschnitte
- SSL-Kanal
- Verankerter gleitender Durchschnitt
- Abweichungsskaliertes gleitendes Mittel
- Gann High Low Aktivator
- Instantane Trendlinie
- Kaufman Adaptive GD mit Trend Vision
- Gleitender Durchschnittskanal
- Gleitende Durchschnitte Suite
- Trendkanal gleitender Durchschnitt
Dienstprogramme/Benutzerdefiniert
Regressionsbasiert
Volatilität
Oszillatoren
__________________________________________________________________________________________
HAFTUNGSAUSSCHLUSS
Der Handel birgt Risiken. Dieser Indikator ist nur für die technische Analyse gedacht – wenden Sie stets ein angemessenes Risikomanagement an und handeln Sie verantwortungsbewusst.
FEEDBACK & VERBESSERUNGEN
Wenn Sie Vorschläge, Funktionswünsche oder Ideen zur Verbesserung haben, hinterlassen Sie bitte einen Kommentar im Diskussions-Tab. Ihr Feedback hilft, den Indikator für alle zu verbessern.
Zusammenfassung
Key functionalities include identifying trend phases—strong uptrends, downtrends, consolidation, and transition zones—by observing BOP behavior relative to the zero line. It also aids in detecting support and resistance confluence, with extreme BOP readings indicating potential exhaustion near key levels and divergences signaling possible rejections or breakthroughs. The indicator helps identify distribution and accumulation phases through price and BOP divergences.
BOP supports multi-timeframe analysis: higher timeframes provide directional bias, while lower timeframes offer entry timing signals via BOP and signal line crossovers and histogram momentum confirmation. The signal line is a moving average of BOP, with crossovers serving as filtered entry/exit triggers. The histogram can display either BOP polarity or the difference between BOP and its signal line, offering early momentum shift warnings.
Adjustable parameters include smoothing periods and types for both BOP and signal lines, and histogram display modes. The indicator is applicable across Forex, indices, commodities, cryptocurrencies, and stocks markets.