Descrizione
Calcola i livelli di supporto e resistenza utilizzando cinque metodi professionali di pivot su qualsiasi intervallo di tempo.
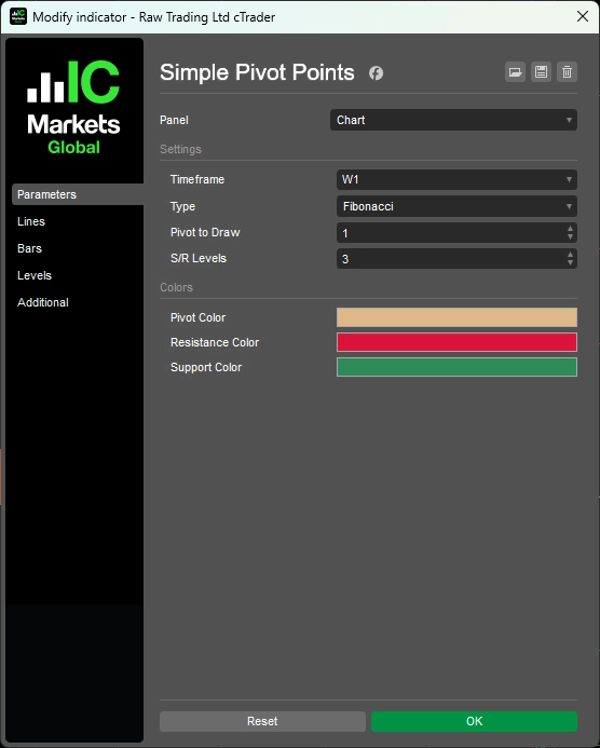
Genera automaticamente livelli pivot (Standard, Fibonacci, Woodie, Camarilla, DeMark) da dati M5 a Mensili con visualizzazione limitata nel tempo per ogni periodo.
Cinque algoritmi di calcolo con logiche distinte di spaziatura S/R, livelli di supporto/resistenza configurabili (0-6 per lato), visualizzazione storica dei pivot per più periodi precedenti, linee etichettate automaticamente (PP, R1-R6, S1-S6) e visualizzazione codificata a colori offrono un'analisi pivot di livello istituzionale per i trader che puntano a livelli chiave di prezzo e inversioni intraday.
CARATTERISTICHE
Cinque Metodi di Calcolo
- Standard: Formula classica del trader di borsa—i pivot più seguiti a livello globale
- Fibonacci: Utilizza rapporti Fib (38,2%, 61,8%, 100%, 138,2%, 161,8%) per la spaziatura S/R
- Woodie: Pesa fortemente il prezzo di chiusura—più reattivo all'azione recente del prezzo
- Camarilla: Livelli intraday stretti usando moltiplicatori 1.1/12—popolare per lo scalping
- DeMark: Formula condizionale basata sul rapporto chiusura vs. apertura—solo 1 livello S/R ma molto rispettato
Personalizzazione Completa
- Qualsiasi intervallo di tempo: Calcola da dati M5, H1, H4, Giornalieri, Settimanali, Mensili
- Pivot storici: Mostra fino a più periodi precedenti (es. ultimi 3 settimane di pivot)
- Livelli configurabili: Visualizza da 0 a 6 livelli di supporto/resistenza per lato
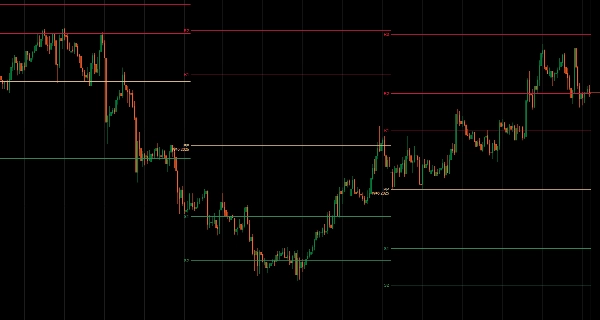
- Linee etichettate automaticamente: PP, R1-R6, S1-S6 chiaramente marcate
- Linee limitate nel tempo: I pivot di ogni periodo sono mostrati solo per la durata di quel periodo
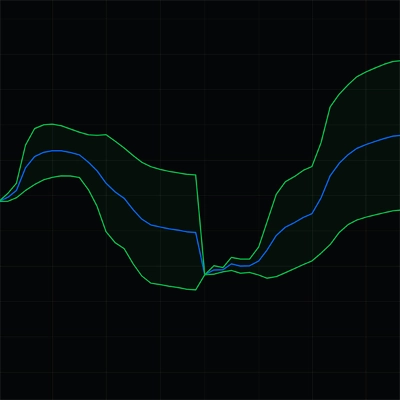
- Codifica a colori: Pivot (tan), Resistenza (rosso), Supporto (verde)
__________________________________________________________________________________________
ALTRI INDICATORI GRATUITI
Esplora un'ampia gamma di strumenti di analisi di mercato—dalla struttura e volume alla regressione, volatilità e intervalli di tempo personalizzati.
Il codice sorgente è disponibile nel repository GitHub.
Tutti gratuiti da usare. Ma se vuoi offrire un supporto per un caffè, puoi farlo qui.
Supporto/Resistenza
Volume
- Volume Activity Profiler
- Volume Efficiency Analyzer
- Volume Profile Analytics
- Volume Profile - Aggiornato
- Volume Spread Analysis
- VWAP (Prezzo Medio Ponderato per Volume)
Medie Mobili
- SSL Channel
- Media Mobile Ancorata
- Media Mobile Scalata per Deviazione
- Gann High Low Activator
- Linea di Tendenza Istantanea
- Media Mobile Adattiva di Kaufman con Trend Vision
- Canale Media Mobile
- Suite Medie Mobili
- Media Mobile Canale di Tendenza
Utility/Personalizzati
- Strumenti per Grafici
- Intervalli di Tempo Personalizzati
- Candlestick di Intervallo di Tempo Superiore
Basati su Regressione
Volatilità
Oscillatori
__________________________________________________________________________________________
DICHIARAZIONE DI NON RESPONSABILITÀ
Il trading comporta rischi. Questo indicatore è destinato esclusivamente all'analisi tecnica — applica sempre una corretta gestione del rischio e opera responsabilmente.
FEEDBACK E MIGLIORAMENTI
Se hai suggerimenti, richieste di funzionalità o idee per miglioramenti, lascia un commento nella scheda Discussione. Il tuo feedback aiuta a migliorare l'indicatore per tutti.
Riepilogo
Recensioni dei clienti
5 | 100 % | |
4 | 0 % | |
3 | 0 % | |
2 | 0 % | |
1 | 0 % |