
Descrizione
PANORAMICA
La Linea di Tendenza Istantanea è un indicatore tecnico sviluppato da John Ehlers, un ingegnere elettrico che ha applicato i principi della elaborazione digitale del segnale (DSP) all'analisi dei mercati finanziari. Originariamente pubblicato sulla rivista Stocks & Commodities (febbraio 2002) e dettagliato nei suoi libri "Rocket Science for Traders" e "Cybernetic Analysis for Stocks and Futures", questo indicatore isola la componente di tendenza dei dati di prezzo filtrando le componenti cicliche (oscillanti).
CONCETTO
A differenza delle medie mobili tradizionali che semplicemente smussano i dati di prezzo, la Linea di Tendenza Istantanea utilizza tecniche matematiche derivate dall'ingegneria elettrica per scomporre l'azione del prezzo in due componenti distinte:
- Componente di Tendenza - La direzione prevalente del mercato
- Componente Ciclica - Le fluttuazioni oscillanti attorno alla tendenza
Applicando filtri notch e la metodologia della Trasformata di Hilbert, Ehlers ha creato un indicatore che risponde rapidamente ai cambiamenti genuini di tendenza filtrando il rumore e i cicli a breve termine. Il risultato è una linea di tendenza che si adatta alle condizioni di mercato con un ritardo significativamente ridotto rispetto alle medie mobili semplici o esponenziali di periodi simili.
Il vantaggio principale di questo approccio è la precisione matematica nel separare ciò che è "tendenza" da ciò che è "rumore ciclico", piuttosto che semplicemente mediare il prezzo su un periodo di osservazione fisso.
COME FUNZIONA
L'indicatore calcola una linea di tendenza smussata usando una formula ricorsiva basata sul parametro Alpha. La formula incorpora:
- Dati di prezzo attuali e recenti (punto medio HL/2)
- Valori precedenti della linea di tendenza
- Coefficiente di smussamento Alpha (default 0.07)
L'indicatore genera anche una linea Trigger, che è la Linea di Tendenza Istantanea spostata di 2 barre. Questa linea trigger viene utilizzata per generare segnali di trading tramite la logica di crossover.
INTERPRETAZIONE
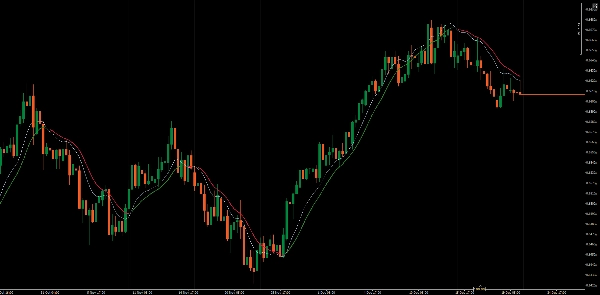
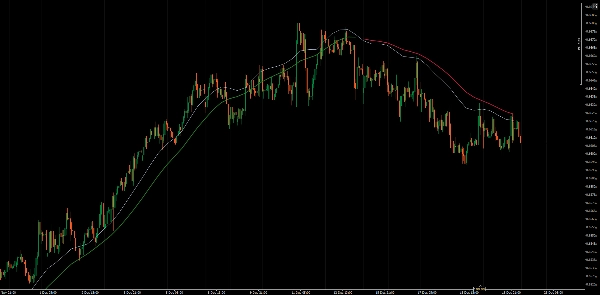
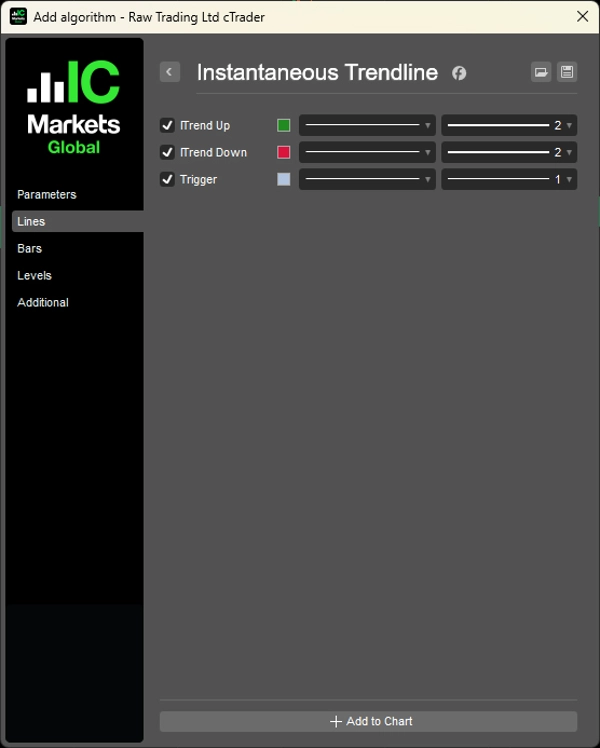
L'indicatore traccia tre linee:
- ITrend Up: Visualizzata quando Trigger > ITrend, indicando condizioni rialziste
- ITrend Down: Visualizzata quando Trigger < ITrend, indicando condizioni ribassiste
- Trigger: La versione ritardata di 2 barre della linea di tendenza
Generazione Segnali:
- Segnale Rialzista: Quando la linea Trigger incrocia verso l'alto la Linea di Tendenza Istantanea
- Segnale Ribassista: Quando la linea Trigger incrocia verso il basso la Linea di Tendenza Istantanea
La visualizzazione codificata a colori rende facile identificare la direzione attuale della tendenza a colpo d'occhio.
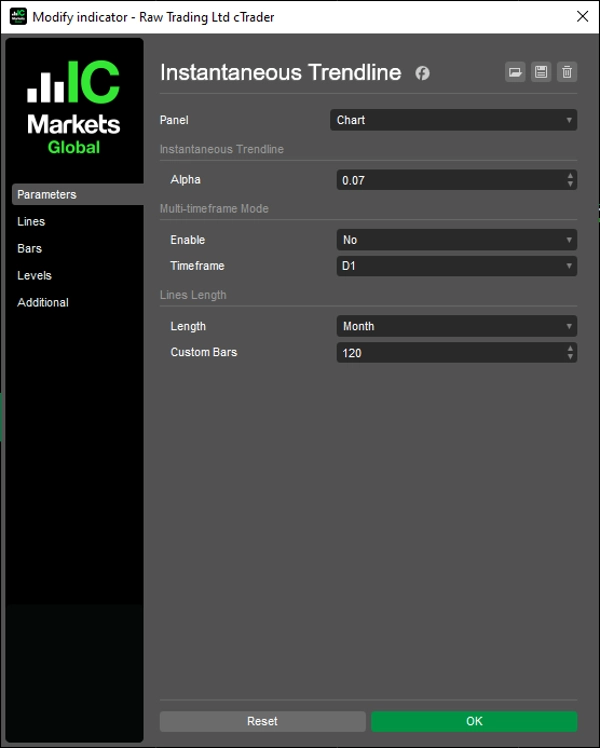
PARAMETRI CHIAVE
Alpha (0.01 - 1.0, default 0.07)
Controlla lo smussamento e la reattività della linea di tendenza. Valori più bassi producono linee di tendenza più lisce e con risposta più lenta, adatte per tendenze a lungo termine. Valori più alti aumentano la sensibilità ai cambiamenti di prezzo ma possono generare più falsi segnali in mercati agitati. Il valore predefinito di 0.07 bilancia reattività e filtraggio del rumore.
Lunghezza Linee (default 120)
Determina quante barre di dati storici della linea di tendenza sono visualizzate sul grafico. Questo aiuta a mantenere il grafico pulito pur mantenendo un contesto sufficiente.
LIMITAZIONI
- Come tutti gli strumenti di trend-following, la Linea di Tendenza Istantanea può produrre whipsaw (falsi segnali) in mercati laterali o senza direzione
- Durante tendenze forti, l'indicatore può mantenerti nella tendenza più a lungo, ma potresti perdere il punto esatto di massimo o minimo
- La performance varia significativamente a seconda delle condizioni di mercato (in tendenza vs. laterale)
- L'indicatore è reattivo, non predittivo - identifica le tendenze dopo che sono iniziate
__________________________________________________________________________________________
ALTRI INDICATORI GRATUITI
Esplora un'ampia gamma di strumenti di analisi di mercato—dalla struttura e volume alla regressione, volatilità e timeframe personalizzati.
Il codice sorgente è disponibile nel repository GitHub repository.
Tutti gratuiti da usare. Ma se vuoi offrire un supporto per un caffè, puoi farlo qui.
Supporto/Resistenza
Volume
- Volume Activity Profiler
- Volume Efficiency Analyzer
- Volume Profile Analytics
- Volume Profile - Aggiornato
- Volume Spread Analysis
- VWAP (Prezzo Medio Ponderato per Volume)
Medie Mobili
- SSL Channel
- Media Mobile Ancorata
- Media Mobile Scalata per Deviazione
- Gann High Low Activator
- Linea di Tendenza Istantanea
- Media Mobile Adattiva di Kaufman con Trend Vision
- Canale Media Mobile
- Suite Medie Mobili
- Media Mobile Canale di Tendenza
Utility/Personalizzati
Basati su Regressione
Volatilità
Oscillatori
__________________________________________________________________________________________
DICHIARAZIONE DI ESCLUSIONE DI RESPONSABILITÀ
Il trading comporta rischi. Questo indicatore è destinato esclusivamente all'analisi tecnica — applica sempre una corretta gestione del rischio e opera responsabilmente.
FEEDBACK E MIGLIORAMENTI
Se hai suggerimenti, richieste di funzionalità o idee per miglioramenti, lascia un commento nella scheda Discussione. Il tuo feedback aiuta a migliorare l'indicatore per tutti.
Riepilogo
Recensioni dei clienti
5 | 100 % | |
4 | 0 % | |
3 | 0 % | |
2 | 0 % | |
1 | 0 % |


