

Price Change Bundle 1.0 BT
インジケーター
2 購入済
バージョン 1.0、Aug 2025
Windows、Mac
4.0
レビュー: 1

51
販売
1.43K
無料インストール
説明
価格変動バンドル — 3つのインジケーター、1つのロジック。
私自身のセットアップ(サプライ&デマンド+カスタムジグザグ)からのツールです。価格が実際にどのように高い時間足のクローズ周辺で動くかを示すために作られています。
任意のモジュールをオン/オフ切り替え — レベル、バー、ヒストグラムを個別に有効/無効にできます。
モジュール
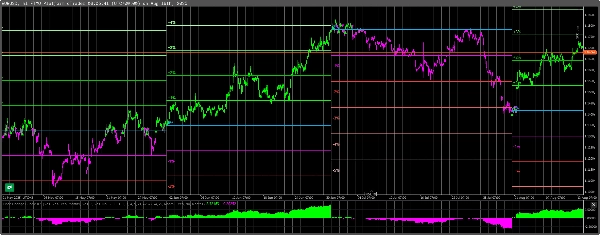
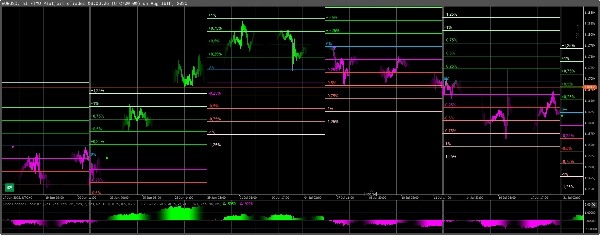
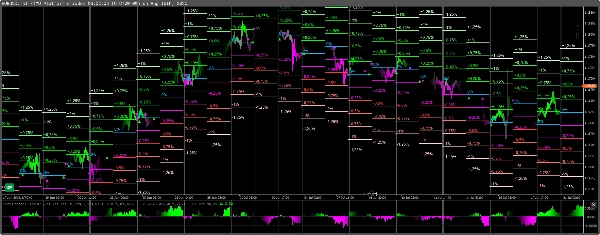
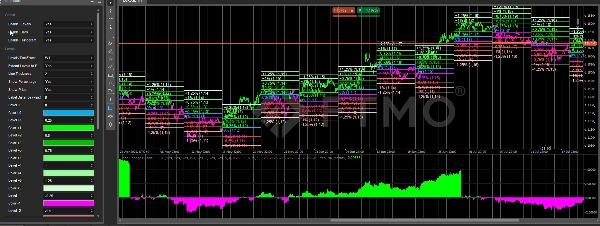
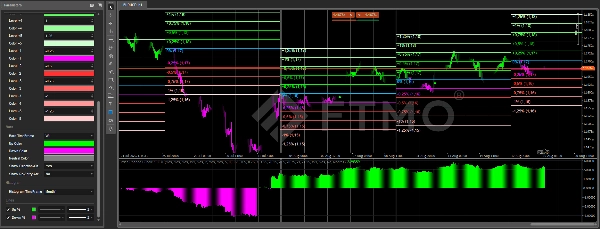
価格変動レベル
- 選択した時間枠内でパーセンテージゾーン(±0.25…±1.25%)を描画します。
- 各ゾーンは0%基準線から測定され、パーセンテージと価格を表示します。
- きれいな週次/月次マップのためにラインを期間の終わりまで延長するオプションがあります。
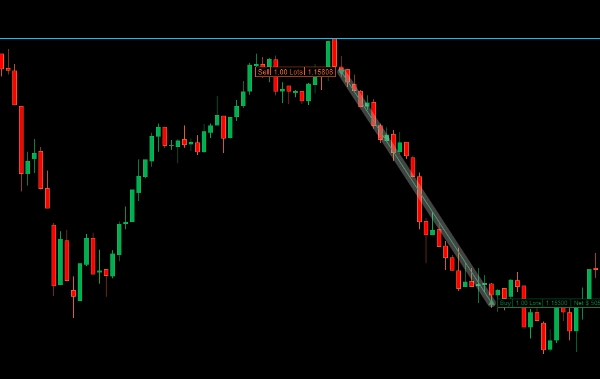
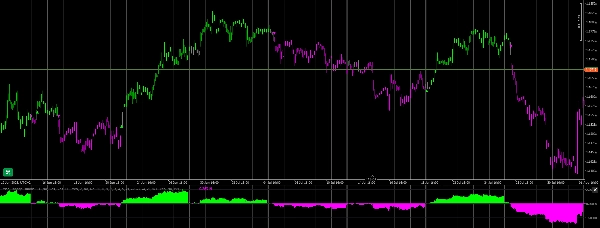
価格変動バー
- TFピボットに対する完全な上/下の状態でローソク足を色分けします。
- エントリーや状態の迅速な把握にはバーのクローズ時が最適です。
- 中立から同じ側への方向転換および再エントリーの矢印を含みます。
価格変動ヒストグラム
- 同じTF参照に対する全体のパーセント変化(上昇% / 下降%)を表示します。
- 加速や減速を一目で見つけるのに最適です。
なぜ機能するのか — 「価格変動の秘密」
- プロは高いTF(MN/W1/D1)の過去のクローズに基づいています。
- その基準から測定されたパーセント距離は実用的な磁石/ターゲットのように機能します。
- ピボットの上/下に完全に位置するローソク足は状態を定義し、中立後の再エントリーはしばしば動きを継続します。
柔軟な使用法
- モジュールごとに任意の時間枠を選択可能(例: MNレベル・W1バー・D1ヒストグラム)。
- 任意のチャートタイプで動作します。Renko/レンジ/ティックも含みます(計算は選択した時間ベースのTFを使用)。
- 再描画なし。軽量。
ビデオ&サポート
- インストール、プリセット、取引例のステップバイステップビデオがまもなく公開されます。
- 購入者は直接私に連絡可能で、質問、セットアップ支援、フィードバックに対応します。個人的に返信します。
概要
AI summary
Price Change Bundle 1.0 BT is a composite indicator consisting of three modules—Levels, Bars, and Histogram—designed to analyze price movements relative to higher timeframe closes. It integrates concepts from Supply & Demand and a custom ZigZag to reveal how price behaves around significant reference points.
- Price Change Levels: Displays percentage zones (±0.25% to ±1.25%) from a 0% baseline within a selected timeframe, showing both percentage and price values. Lines can be extended to the period’s end for clear weekly or monthly mapping.
- Price Change Bars: Colors candles based on their position relative to the timeframe pivot, indicating regimes with full above/below coloring. Includes arrows signaling direction changes and re-entries after neutral phases, aiding entry decisions.
- Price Change Histogram: Illustrates overall percentage development (Up%/Down%) against the same timeframe reference, facilitating quick identification of acceleration or slowdowns.
Each module can be toggled on or off independently and configured with different timeframes. The indicator works on any chart type, including Renko, range, and tick charts, using time-based timeframe calculations. It anchors calculations to previous closes of higher timeframes (monthly, weekly, daily) and does not repaint. Buyers have access to direct support from the developer.
- Price Change Levels: Displays percentage zones (±0.25% to ±1.25%) from a 0% baseline within a selected timeframe, showing both percentage and price values. Lines can be extended to the period’s end for clear weekly or monthly mapping.
- Price Change Bars: Colors candles based on their position relative to the timeframe pivot, indicating regimes with full above/below coloring. Includes arrows signaling direction changes and re-entries after neutral phases, aiding entry decisions.
- Price Change Histogram: Illustrates overall percentage development (Up%/Down%) against the same timeframe reference, facilitating quick identification of acceleration or slowdowns.
Each module can be toggled on or off independently and configured with different timeframes. The indicator works on any chart type, including Renko, range, and tick charts, using time-based timeframe calculations. It anchors calculations to previous closes of higher timeframes (monthly, weekly, daily) and does not repaint. Buyers have access to direct support from the developer.
インジケーターのプロフィール
カスタマーレビュー
4.0
レビュー: 1
5 | 0 % | |
4 | 100 % | |
3 | 0 % | |
2 | 0 % | |
1 | 0 % |
カスタマーレビュー
February 9, 2026
Price Change Bundle 1.0 BT delivers clear and practical price-change metrics. Best used on M10-H1, where momentum readings stay balanced and meaningful. Great for filtering weak moves, confirming impulse strength and improving intraday timing. A simple but effective companion for momentum-based strategies.
ディスカッション
よくあるご質問
Prop
Forex
Signal
Breakout
Indices
cTrader Storeで入手可能な取引ボット、インジケーター、プラグインなどの商品は、第三者の開発者が提供するものであり、情報と技術の取得のみを目的としてご利用いただけます。cTrader Storeはブローカーではなく、投資助言や個人的な推奨を行うことも、将来のパフォーマンスを保証することもありません。























価格
51
販売
1.43K
無料インストール