
Description
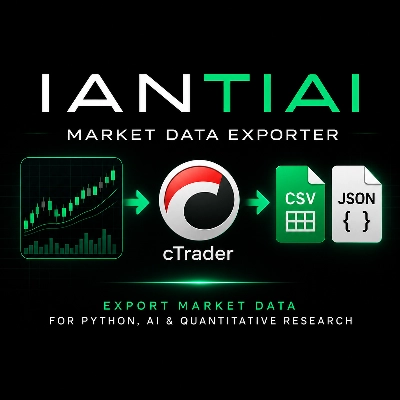
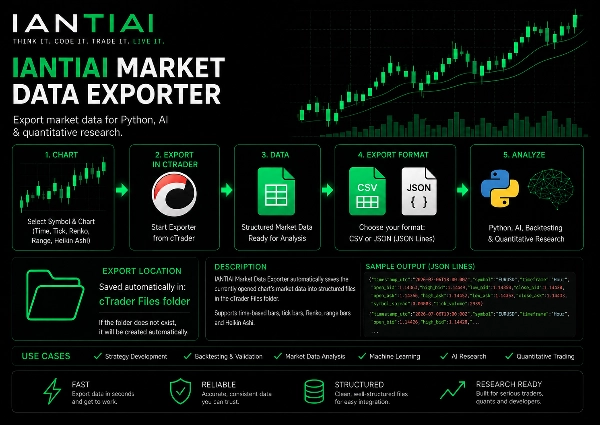
Export market data directly from the active cTrader chart into structured CSV or JSON files for external research, backtesting, Python analysis and quantitative workflows.
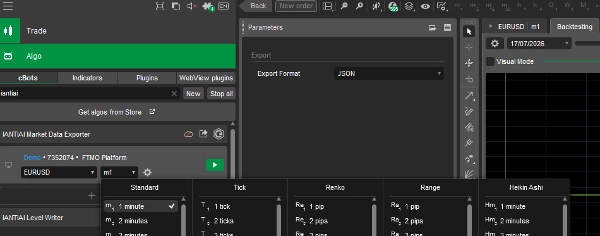
The exporter automatically uses the currently selected symbol, chart type and timeframe in cTrader. No additional timeframe configuration is required.
Supported Chart Types
The exporter works directly with the active cTrader chart and supports:
- Standard time-based bars
- Tick Bars such as T1, T5, T10, T50 and others
- Renko Bars / Renko Bricks
- Range Bars
- Heikin Ashi
- Other supported cTrader chart configurations
Simply select the chart you want to analyse and start the exporter.
Bid, Ask & Spread Information
The exported dataset contains both Bid and Ask OHLC values, together with a spread value and tick-volume information.
This allows the difference between Bid and Ask to be included in downstream research, backtesting and quantitative analysis.
Exported fields include:
- Timestamp UTC
- Symbol
- Timeframe / chart type
- Bid Open
- Bid High
- Bid Low
- Bid Close
- Ask Open
- Ask High
- Ask Low
- Ask Close
- Spread
- Tick Volume
Built for Research
The exported files can be used for:
- Python and pandas analysis
- AI and machine-learning research
- Backtesting and strategy validation
- Bid/Ask and spread-aware analysis
- Excel analysis
- Quantitative trading research
- Market-data analysis
- Custom research pipelines
Export Formats
CSV
Ideal for pandas, Excel, backtesting and traditional quantitative analysis.
JSON
Ideal for Python applications, AI workflows, APIs and structured data processing.
Export Location
Exported files are saved automatically in the local cTrader Files folder.
If the required folder does not exist, it is created automatically when the exporter starts.
A separate file is created for each selected symbol and chart configuration.
Examples:
IANTIAI_Export_EURUSD_Minute5.csv
IANTIAI_Export_EURUSD_Tick10.csv
IANTIAI_Export_EURUSD_Renko10.csv
The same naming structure is used for JSON exports.
Simple Workflow
Select the symbol and chart → Start the exporter → Analyse the data.
Use standard candles, Tick Bars, Renko Bricks, Range Bars or Heikin Ashi — the exporter follows the chart selected in cTrader.
Export market data for Python, AI & quantitative research.
Summary
The exported dataset contains detailed bid and ask OHLC values, spread, and tick volume, enabling analysis that accounts for bid-ask differences. Exported fields include timestamp (UTC), symbol, timeframe/chart type, bid open/high/low/close, ask open/high/low/close, spread, and tick volume.
Files are saved automatically in the local cTrader Files folder, with separate files created for each symbol and chart configuration. Export formats are CSV, suitable for pandas, Excel, and backtesting, and JSON, ideal for Python applications, AI workflows, APIs, and structured data processing.
This exporter supports workflows such as Python and pandas analysis, AI and machine-learning research, backtesting, bid/ask and spread-aware analysis, Excel analysis, quantitative trading research, market-data analysis, and custom research pipelines. The workflow is straightforward: select the symbol and chart in cTrader, start the exporter, and analyze the resulting data.
Customer reviews
5 | 100 % | |
4 | 0 % | |
3 | 0 % | |
2 | 0 % | |
1 | 0 % |