Descrizione
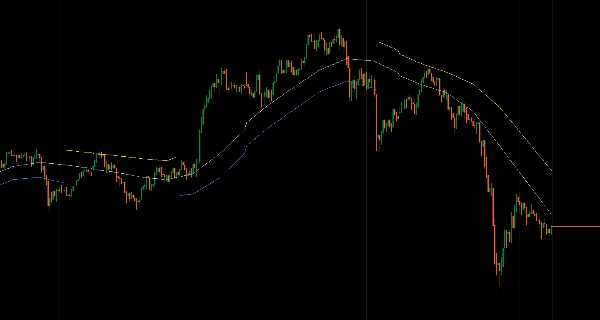
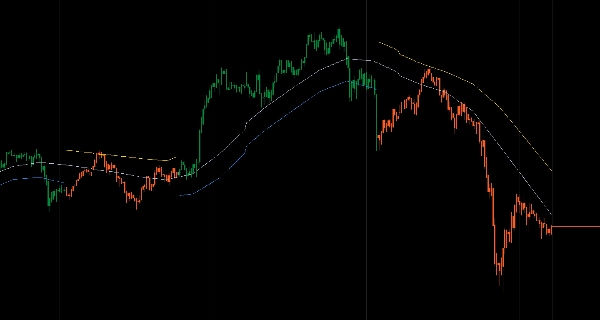
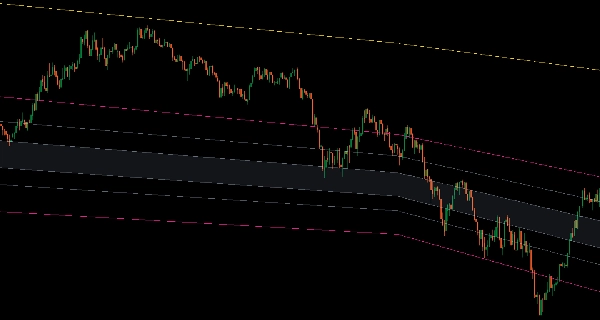
Sistema a canale adattivo a tre colori che utilizza medie mobili su tutti e quattro i prezzi OHLC per l'analisi della direzione e della struttura del trend.
Visualizza i confini High/Low, le linee di bias direzionale Open/Close e l'equilibrio mediano con stati di trend codificati a colori (Blu trend rialzista, Oro trend ribassista, Grigio neutro) che si adattano insieme.
Due modalità di visualizzazione (canale completo o riduzione del disordine basata sul trend), sei zone Fibonacci opzionali (ritracciamenti del canale completo, livelli di mezzo canale, estensioni di breakout), 15 algoritmi di media mobile (Arnaud Legoux, Jurik, Hull, KAMA, VIDYA, Deviation Scaled, SuperSmoother, Ultimate Smoother, McGinley Dynamic, T3, ZLEMA, Laguerre), interpolazione multi-timeframe, calcolo della data di ancoraggio per periodi di crescita basati su eventi, e colorazione delle barre basata sul trend offrono una struttura di canale coerente per i trader che puntano a ritracciamenti e ritorni alla media entro confini definiti.
CARATTERISTICHE
Sistema di Trend a Tre Colori
- Linee blu: trend rialzista confermato—operare sui ritracciamenti verso la linea bassa
- Linee oro: trend ribassista confermato—operare sui rimbalzi verso la linea alta
- Linee grigie: neutro/in trading laterale—evitare gli estremi, fare scalp al centro
- Tutte le linee si adattano insieme—nessun segnale misto
Struttura Completa del Canale
- Le linee High/Low definiscono i confini del canale
- Le linee Open/Close mostrano il bias direzionale all'interno del canale
- La linea mediana (centro dei quattro prezzi) segna il vero equilibrio
- Struttura integrata che si muove in modo coerente
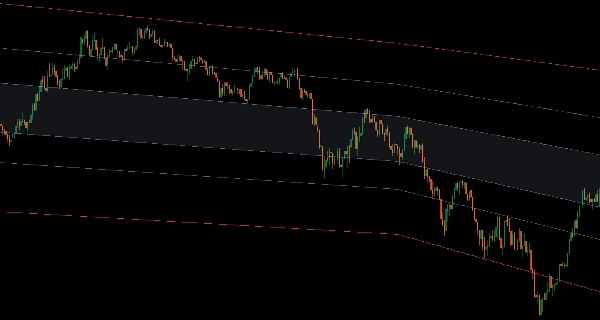
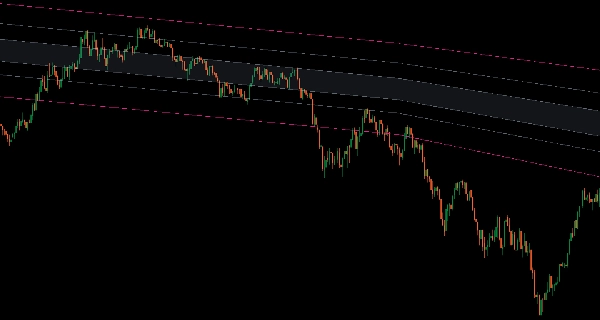
Due Modalità di Visualizzazione
- Modalità Canale: mostra sempre entrambi i confini con i colori del trend
- Modalità Basata sul Trend: nasconde la linea alta nei trend rialzisti, la linea bassa nei trend ribassisti—riduce il disordine visivo, mantiene il focus sul confine operabile
6 Zone Fibonacci (Opzionali)
- Tra Low-High (ritracciamenti del canale completo)
- Tra Low-Median o Median-High (livelli di mezzo canale)
- Estensioni superiori/inferiori (obiettivi di breakout)
- Intervallo totale (dall'estensione inferiore a quella superiore)
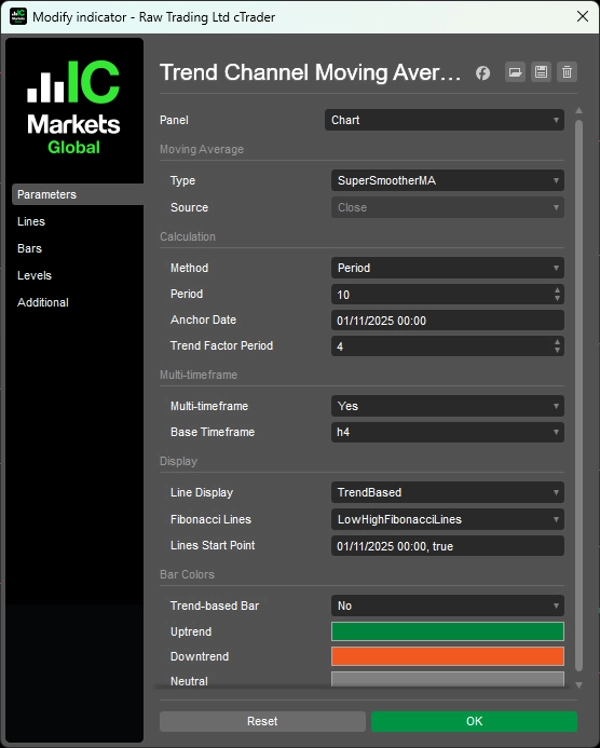
15 Tipi di Medie Mobili
- Algoritmi professionali: Arnaud Legoux, Jurik, Hull, KAMA, VIDYA, Deviation Scaled, SuperSmoother, Ultimate Smoother, McGinley Dynamic, T3, ZLEMA, Laguerre
- Segnali puliti ottimizzati per l'identificazione del trend
Funzionalità Avanzate
- Modalità multi-timeframe con interpolazione fluida
- Calcolo della data di ancoraggio (periodo di crescita da evento/livello specifico)
- Colorazione delle barre basata sul trend (opzionale)
- Controllo del punto di partenza delle linee (nascondi dati storici, mostra solo la struttura recente)
__________________________________________________________________________________________
ALTRI INDICATORI GRATUITI
Esplora una vasta gamma di strumenti di analisi di mercato—dalla struttura e volume alla regressione, volatilità e timeframe personalizzati.
Il codice sorgente è disponibile nel repository GitHub.
Tutti gratuiti da usare. Ma se vuoi offrire un supporto per un caffè, puoi farlo qui.
Supporto/Resistenza
Volume
- Volume Activity Profiler
- Volume Efficiency Analyzer
- Volume Profile Analytics
- Volume Profile - Aggiornato
- Volume Spread Analysis
- VWAP (Prezzo Medio Ponderato per il Volume)
Medie Mobili
- SSL Channel
- Media Mobile Ancorata
- Media Mobile Deviation-Scaled
- Gann High Low Activator
- Linea di Tendenza Istantanea
- Kaufman Adaptive MA con Trend Vision
- Canale Media Mobile
- Suite Medie Mobili
- Media Mobile Canale Trend
Utility/Personalizzati
Basato sulla Regressione
Volatilità
Oscillatori
__________________________________________________________________________________________
DICHIARAZIONE DI RESPONSABILITÀ
Il trading comporta rischi. Questo indicatore è destinato esclusivamente all'analisi tecnica — applica sempre una corretta gestione del rischio e opera responsabilmente.
FEEDBACK E MIGLIORAMENTI
Se hai suggerimenti, richieste di funzionalità o idee per miglioramenti, lascia un commento nella scheda Discussione. Il tuo feedback aiuta a migliorare l'indicatore per tutti.
Riepilogo
Key features include two display modes—full channel and trend-based clutter reduction—and six optional Fibonacci zones covering full and half-channel retracements plus breakout extensions. The system supports 15 professional moving average algorithms such as Arnaud Legoux, Jurik, Hull, KAMA, VIDYA, and others, optimized for clean trend identification. Additional functionalities include multi-timeframe interpolation, anchor date calculation for event-based periods, trend-based bar coloring, and control over line start points to focus on recent data.
This indicator is designed to help traders identify pullbacks and mean reversion opportunities within defined channel boundaries, enhancing decision-making in various market conditions.
Recensioni dei clienti
5 | 100 % | |
4 | 0 % | |
3 | 0 % | |
2 | 0 % | |
1 | 0 % |