
Descrizione
Struttura dell'intervallo di apertura su qualsiasi periodo—dalle sessioni intraday ai cicli annuali—con livelli di Fibonacci e proiezioni di estensione.
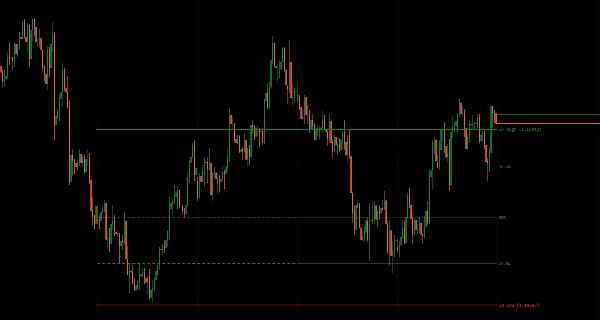
Segna l'intervallo Alto/Basso stabilito durante i periodi di apertura (Giornaliero, Settimanale, Mensile, Trimestrale, Annuale o Intervallo Personalizzato) come riferimento per breakout, ritorno alla media e aspettative di volatilità.
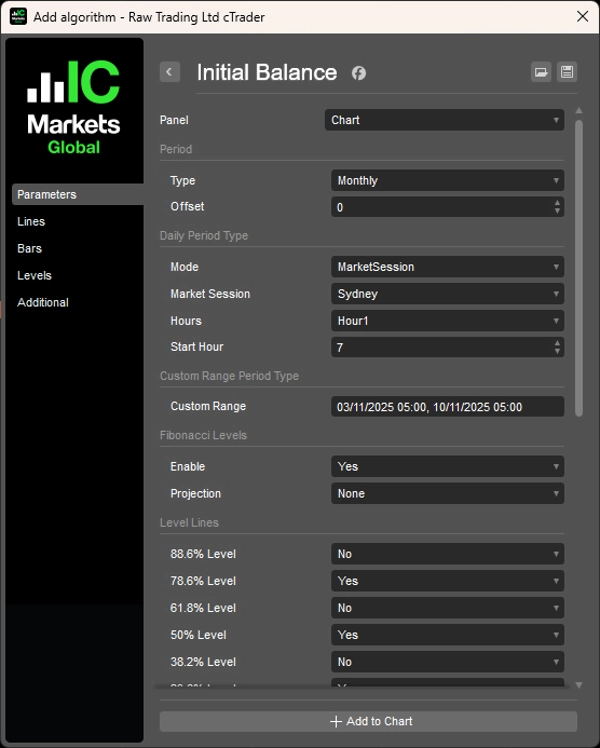
Otto tipi di periodo con rilevamento della sessione consapevole del fuso orario (Sydney/Tokyo/Londra/NY), offset storico per confronto multi-periodo, sette livelli di Fibonacci opzionali (11,4% a 88,6%) all'interno dell'intervallo IB, proiezioni verso l'alto/il basso dai confini, controllo flessibile dell'estensione della linea (solo periodo IB, barra corrente o N periodi avanti) e rilevamento preciso del periodo offrono un'analisi completa dell'intervallo di apertura per i trader che mirano a setup basati sulla struttura su tutti i timeframe.
CARATTERISTICHE
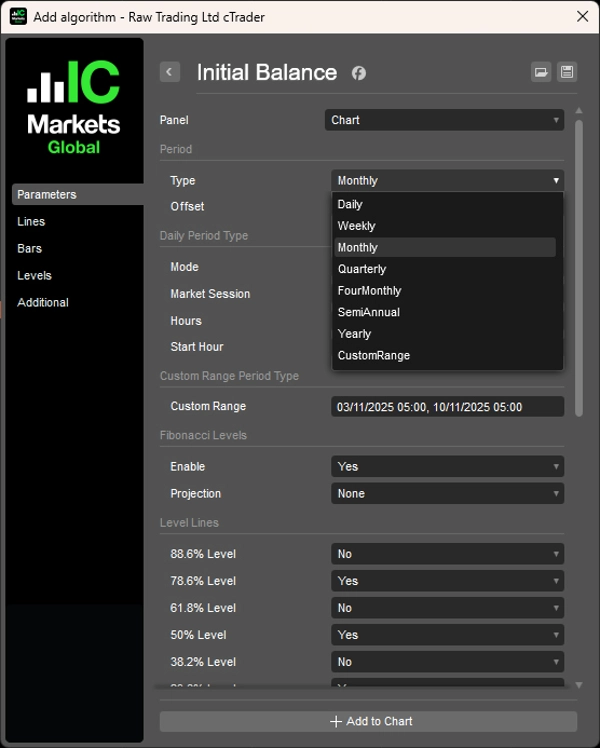
8 Tipi di Periodo
- Giornaliero, Settimanale, Mensile, Trimestrale, 4 Mesi, Semestrale, Annuale, Intervallo Personalizzato
- Modalità Giornaliera: basata su ore (1-12 ore) o Sessione di Mercato (Sydney/Tokyo/Londra/NY)
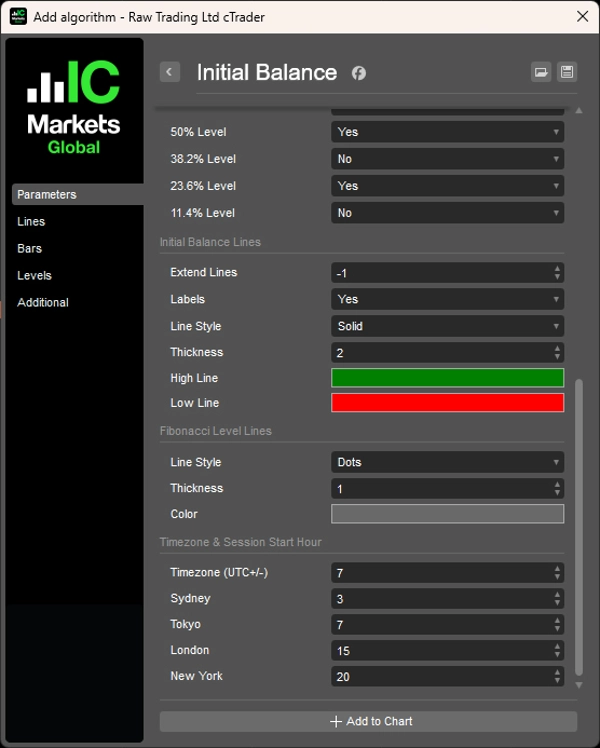
- Orari di inizio sessione configurabili con regolazione offset UTC consapevole del fuso orario
- Intervallo Personalizzato: definisci data/ora di inizio/fine esatte per analisi basate su eventi
Periodi Storici
- Parametro offset per visualizzare intervalli IB passati (es. IB della settimana scorsa, IB del mese scorso)
- Confronta l'azione del prezzo attuale con le strutture del periodo precedente
- Analisi multi-periodo per conferma del trend
Livelli di Fibonacci
- 7 livelli opzionali (11,4%, 23,6%, 38,2%, 50%, 61,8%, 78,6%, 88,6%) all'interno dell'intervallo IB
- Zone di ritorno alla media all'interno del bilanciamento
- Punti di riferimento precisi per entrata/uscita
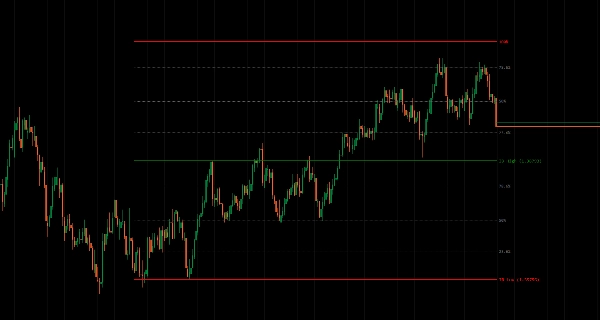
Proiezioni di Fibonacci
- Proietta livelli verso l'alto/il basso dall'alto/basso IB
- Obiettivi potenziali di breakout oltre l'intervallo
- Zone di estensione per movimenti direzionali
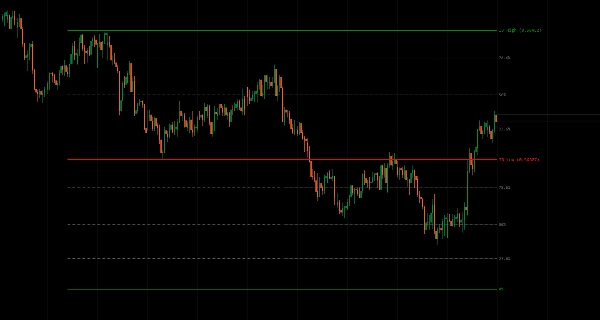
Controllo Estensione Linea
- Solo periodo IB: mostra l'intervallo durante il periodo di formazione
- Barra corrente: estendi fino al presente
- N periodi avanti: proietta nel futuro per la pianificazione
- Gestione visiva pulita
Rilevamento Preciso del Periodo
- Calcolo accurato dell'intervallo di apertura per ogni tipo di periodo
- Consapevole del fuso orario per mercati globali
- Gestisce pulitamente sovrapposizioni e transizioni di sessione
__________________________________________________________________________________________
PIÙ INDICATORI GRATUITI
Esplora un'ampia gamma di strumenti di analisi di mercato—dalla struttura e volume alla regressione, volatilità e timeframe personalizzati.
Il codice sorgente è disponibile nel repository GitHub.
Tutti gratuiti da usare. Ma se vuoi offrire un caffè di supporto, puoi farlo qui.
Supporto/Resistenza
Volume
- Profiler di Attività di Volume
- Analizzatore di Efficienza del Volume
- Analisi del Profilo di Volume
- Profilo di Volume - Aggiornato
- Analisi della Distribuzione del Volume
- VWAP (Prezzo Medio Ponderato per il Volume)
Medie Mobili
- Canale SSL
- Media Mobile Ancorata
- Media Mobile Scalata per Deviazione
- Attivatore Gann High Low
- Linea di Tendenza Istantanea
- Media Mobile Adattiva di Kaufman con Visione del Trend
- Canale Media Mobile
- Suite di Medie Mobili
- Media Mobile Canale di Tendenza
Utilità/Personalizzati
Basato su Regressione
Volatilità
Oscillatori
__________________________________________________________________________________________
DICHIARAZIONE DI NON RESPONSABILITÀ
Il trading comporta rischi. Questo indicatore è destinato esclusivamente all'analisi tecnica — applica sempre una corretta gestione del rischio e opera responsabilmente.
FEEDBACK E MIGLIORAMENTI
Se hai suggerimenti, richieste di funzionalità o idee per miglioramenti, lascia un commento nella scheda Discussione. Il tuo feedback aiuta a migliorare l'indicatore per tutti.
Riepilogo
Key features include configurable session start times with UTC offset adjustments, historical offset parameters for comparing past initial balance ranges, and multi-period analysis for trend confirmation. It offers optional Fibonacci retracement levels (11.4% to 88.6%) within the initial balance range to highlight mean reversion zones and precise entry or exit points. Additionally, Fibonacci projections extend upward or downward from the initial balance boundaries to indicate potential breakout targets and directional extension zones.
Line extension controls allow users to display the range during its formation, extend it to the current bar, or project it forward for planning purposes. The indicator ensures precise period detection, handling session overlaps and transitions accurately for global market analysis. This tool aids traders in identifying breakout, mean reversion, and volatility expectations based on opening range structures across all timeframes.
Recensioni dei clienti
5 | 50 % | |
4 | 50 % | |
3 | 0 % | |
2 | 0 % | |
1 | 0 % |


