Descrizione
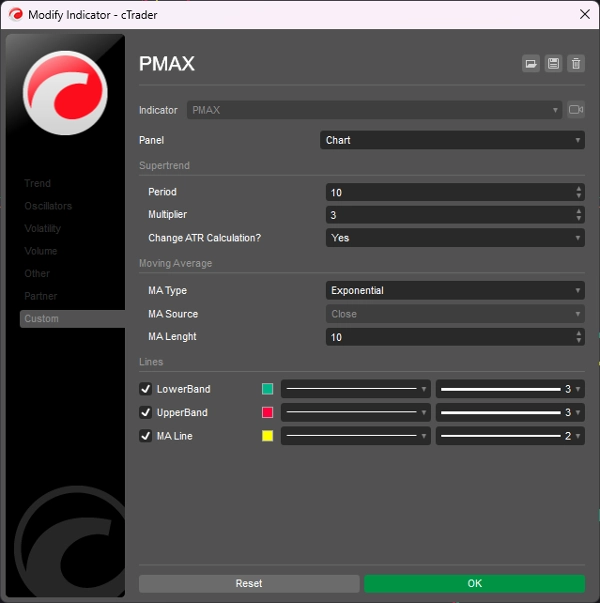
PMax (Profit Maximizer) è un indicatore completamente nuovo sviluppato da KivancOzbilgic all'inizio del 2020.
È una combinazione di due indicatori di trailing stop loss;
Uno è l'indicatore MOST (Moving Stop Loss) di Anıl Özekşi e l'altro è il ben noto SuperTrend basato su ATR.
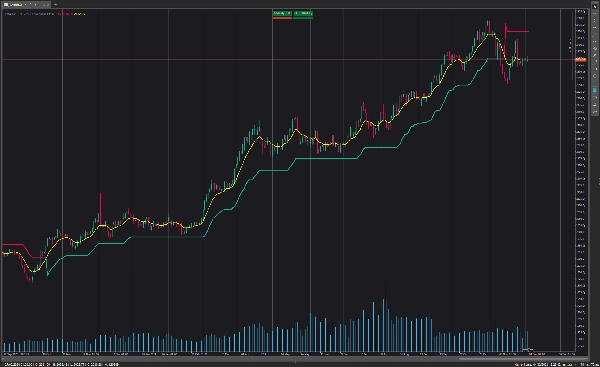
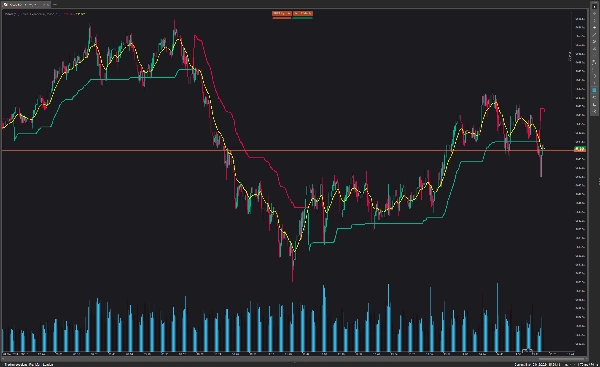
Sia gli indicatori MOST che SuperTrend sono molto efficaci nei sistemi di trend following, ma al contrario la loro performance non è brillante in condizioni di mercato laterale come la maggior parte degli altri indicatori.
Profit Maximizer - PMax cerca di risolvere questo problema. PMax combina i lati potenti di MOST (Moving Average Trend Changer) e SuperTrend (rilevamento prezzo ATR) in un unico indicatore.
I risultati di backtest e ottimizzazione di PMax sono molto migliori rispetto ai suoi predecessori MOST e SuperTrend. Riduce il numero di segnali falsi nei mercati laterali e fornisce segnali di trading più affidabili.
PMax è facile da usare per determinare il trend e può essere utilizzato in qualsiasi tipo di mercato e strumento. Non effettua repaint.
Riepilogo
This combination enhances trend identification and reduces false signals during non-trending market phases. Backtesting and optimization show that PMax outperforms its component indicators in reliability and signal accuracy. It is designed for use across various markets and instruments and does not repaint, providing consistent signals for traders.
Recensioni dei clienti
5 | 100 % | |
4 | 0 % | |
3 | 0 % | |
2 | 0 % | |
1 | 0 % |