
Chaikin Money Flow
Indicatore
139 download
Versione 1.0, Dec 2024
Windows, Mac
5.0
Recensioni: 1

2
Vendite
7.24K
Installazioni gratuite
Descrizione
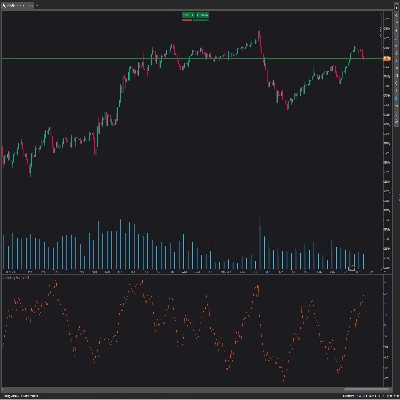
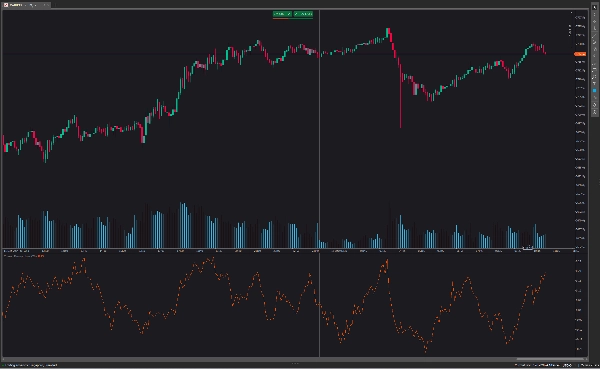
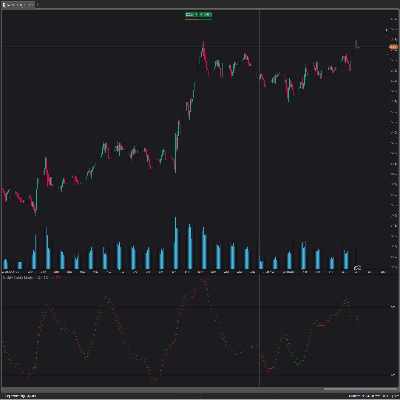
Lo scopo principale del Chaikin money flow è distinguere tra periodi di accumulo e distribuzione di un titolo. Quando l'indicatore è sopra la linea zero, indica che il titolo sta vivendo un accumulo netto, suggerendo che gli investitori stanno acquistando l'asset.
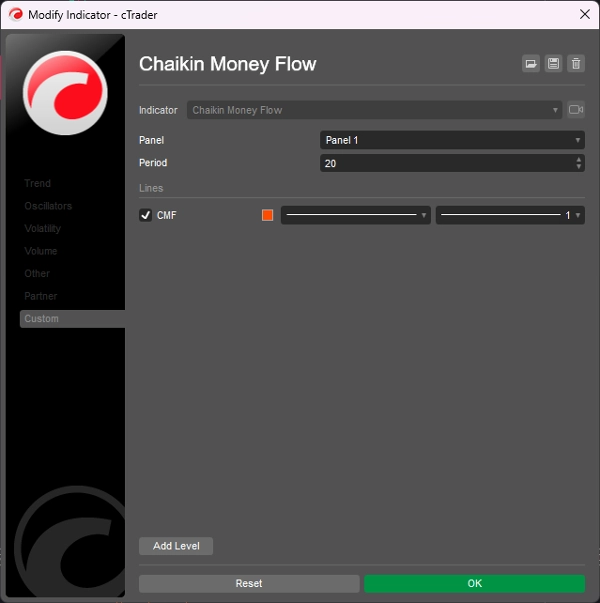
- Le impostazioni di Chaikin Money Flow con valori superiori a 30 rendono l'indicatore meno sensibile. Ciò si tradurrà in segnali meno frequenti, ma di migliore qualità.
- Le impostazioni di Chaikin Money Flow con valori inferiori a 20 rendono l'indicatore ipersensibile. Ciò comporterà più rumore di mercato.
- Indica una tendenza al rialzo continua quando l'indicatore CMF attraversa la linea zero dall'alto verso il basso e genera segnali long/acquisto.
- Indica una tendenza al ribasso continua quando l'indicatore CMF attraversa la linea zero dal basso verso l'alto e genera segnali short/vendita.
Riepilogo
Riepilogo AI
The Chaikin Money Flow (CMF) indicator is designed to identify periods of accumulation and distribution for a security. When the CMF value is above zero, it signals net accumulation, indicating buying pressure. Conversely, values below zero suggest distribution or selling pressure. The indicator’s sensitivity can be adjusted: settings above 30 reduce sensitivity, producing fewer but higher-quality signals, while settings below 20 increase sensitivity, resulting in more market noise. Key signals include a continued uptrend when the CMF crosses the zero line from above, generating buy signals, and a continued downtrend when it crosses from below, generating sell signals. This tool helps traders assess buying and selling momentum to inform trading decisions.
Profilo indicatore
Recensioni dei clienti
5.0
Recensioni: 1
5 | 100 % | |
4 | 0 % | |
3 | 0 % | |
2 | 0 % | |
1 | 0 % |
Recensioni dei clienti
August 18, 2025
Reliable volume-based trend confirmation, easy to read, customizable period. Cons: No alerts, no MTF analysis, limited filtering options.
Discussioni
Domande frequenti
I prodotti disponibili tramite cTrader Store, inclusi bot di trading, indicatori e plugin, sono forniti da sviluppatori terzi e resi disponibili esclusivamente a scopo informativo e di accesso tecnico. cTrader Store non è un broker e non fornisce consulenze in materia di investimento, raccomandazioni individualizzate o garanzie di risultati futuri.
Altro da questo autore

















Prezzo
2
Vendite
7.24K
Installazioni gratuite