
Descrizione
Teoria della Darvas Box
La teoria della Darvas Box è una tecnica di trading sviluppata da Nicolas Darvas negli anni '50. È una strategia di trading basata sul momentum che utilizza l'azione del prezzo per identificare potenziali punti di ingresso e uscita nel mercato.
Come Funziona la Darvas Box
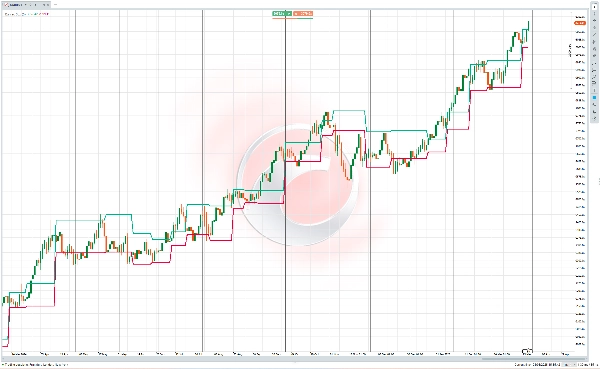
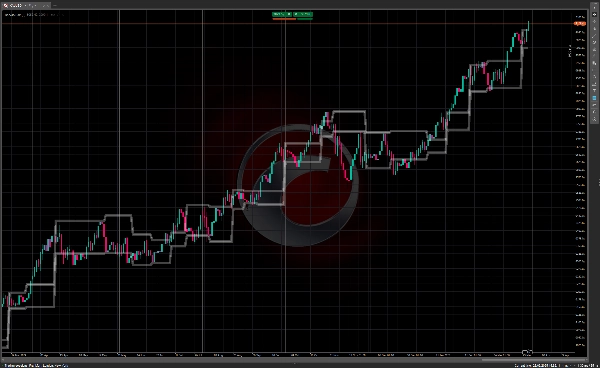
Il metodo Darvas Box consiste nell'identificare "scatole" o intervalli di trading in cui il prezzo di un'azione si consolida prima di una rottura. I componenti chiave includono:
- Il prezzo forma un intervallo di trading definito (la "scatola") con confini superiori e inferiori chiari
- Il confine superiore rappresenta la resistenza, mentre il confine inferiore funge da supporto
- Una rottura al di sopra della scatola segnala una potenziale opportunità di acquisto
- Una rottura al di sotto della scatola può essere utilizzata come segnale di vendita
I trader che utilizzano questa tecnica solitamente cercano azioni che mostrano un aumento del volume insieme al movimento del prezzo, poiché ciò suggerisce un momentum più forte dietro la rottura.
Storia della Teoria della Darvas Box
Nicolas Darvas (1920-1977) è stata una figura piuttosto insolita nella storia del trading. Nato in Ungheria, non era un trader professionista di formazione, ma un ballerino che si esibiva in un duo di danza da sala chiamato "Darvas and Julia" con la sua sorellastra.
Durante i tour mondiali con la sua compagnia di danza negli anni '50, Darvas iniziò a sperimentare il trading azionario. Le sue circostanze erano uniche: spesso prendeva decisioni di investimento basandosi solo sulle tabelle azionarie dei giornali che gli venivano consegnati nelle varie città durante il tour.
Darvas sviluppò la sua teoria della scatola attraverso tentativi ed errori. Inizialmente perse denaro nei mercati, ma gradualmente affinò il suo approccio. Tra il 1956 e il 1958, si dice che abbia trasformato un investimento di 10.000 dollari in oltre 2 milioni di dollari usando il suo metodo della scatola, un'impresa straordinaria che attirò l'attenzione.
Nel 1960, Darvas pubblicò i suoi metodi nel libro "How I Made $2,000,000 in the Stock Market", che divenne un classico della letteratura sul trading. Il libro raccontava il suo percorso e spiegava la sua teoria della scatola, portando questo approccio all'attenzione del grande pubblico.
Ciò che rese il metodo di Darvas particolarmente notevole fu la sua semplicità e il fatto che fosse stato sviluppato da un estraneo all'industria finanziaria. Si concentrava principalmente sull'azione del prezzo e sul volume piuttosto che sull'analisi fondamentale, un approccio che all'epoca era piuttosto innovativo ma che da allora ha influenzato molti sistemi di trading tecnico.
La tecnica della Darvas Box rimane popolare tra i trader tecnici oggi, in particolare tra coloro che seguono strategie basate sul momentum nei mercati in trend.


![Logo di "Smart Money Concepts (SMC) [Iridio Capital]"](https://cdn.ctrader.com/image/webp/28b69fd1-ef54-4bed-9487-07e78e883be4_40934)


