
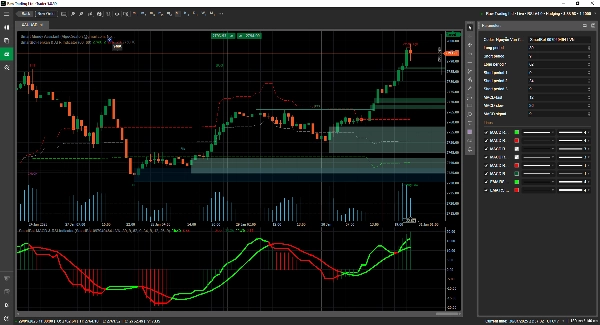
SmartBot-MACD & RSI Indicator
Indicatore
4 acquisti
Versione 1.0, Jan 2025
Windows, Mac
4.3
Recensioni: 3
Descrizione
🚀 Presentazione dell'Indicatore MACD-RSI Definitivo! 🚀
Scopri la fusione perfetta di MACD e RSI in un unico indicatore potente! Questo strumento avanzato combina la forza del momentum dell'RSI con la precisione nel seguire il trend del MACD, offrendoti segnali più chiari, rumore ridotto e ingressi & uscite più intelligenti.
🔥 Perché Usare Questo Indicatore? 🔥
✅ Il Meglio di Entrambi i Mondi: RSI per il momentum + MACD per la conferma del trend.
✅ Segnali Più Precisi: Elimina i falsi movimenti e migliora il processo decisionale.
✅ Perfetto per Tutti i Trader: Funziona in tutte le condizioni di mercato e stili di trading.
Aggiorna oggi la tua strategia con questo indicatore rivoluzionario! 📈🔥
Riepilogo
Profilo indicatore
Recensioni dei clienti
4.3
Recensioni: 3
5 | 33 % | |
4 | 67 % | |
3 | 0 % | |
2 | 0 % | |
1 | 0 % |
Recensioni dei clienti
January 21, 2025
Tested small first and that felt like the right move. Overconfidence is the real danger.
January 21, 2025
Discussioni
Domande frequenti
RSI
MACD
I prodotti disponibili tramite cTrader Store, inclusi bot di trading, indicatori e plugin, sono forniti da sviluppatori terzi e resi disponibili esclusivamente a scopo informativo e di accesso tecnico. cTrader Store non è un broker e non fornisce consulenze in materia di investimento, raccomandazioni individualizzate o garanzie di risultati futuri.


Prezzo
Da 29/11/2024
32
Vendite
975
Installazioni gratuite