
Descrizione
VWAP (Volume Weighted Average Price) è un parametro di riferimento per il trading che calcola il prezzo medio di un asset aggiustato in base al volume di scambio su un periodo specificato. È ampiamente utilizzato da trader giornalieri, istituzioni e sistemi di trading algoritmico per valutare il valore equo e ottimizzare l'esecuzione delle operazioni.
Formula Chiave:
VWAP=∑(Price×Volume)/∑Volume
- Prezzo = Prezzo tipico (Massimo + Minimo + Chiusura) / 3 o semplicemente prezzo di chiusura.
- Volume = Volume di scambio per ogni periodo.
2. Perché usare il VWAP?
Scopo:
1)Riferimento al Valore Equo
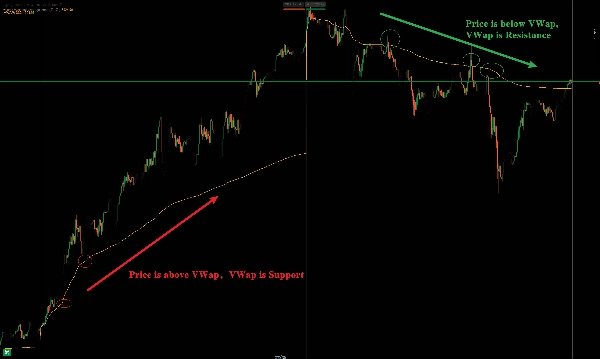
Prezzo > VWAP = tendenza rialzista; Prezzo < VWAP = tendenza ribassista.
2)Supporto/Resistenza Dinamici
Agisce come livello chiave per breakout/reversal intraday.
3) Conferma del Trend
Prezzo che si mantiene sopra il VWAP = Trend rialzista; Sotto = Trend ribassista.
Volume Weighted Average Price (VWAP) 指标详解及用法
1. 基本概念
VWAP(成交量加权平均价) 是一种技术分析工具,用于衡量资产在特定时间段内的平均交易价格,并根据成交量进行加权计算。它帮助交易者判断当前价格相对于市场的“公平价值”,常用于日内交易、算法交易和机构执行订单。
核心公式:
VWAP=∑(Price×Volume)/∑Volume
每条K线的价格 × 成交量累加,再除以总成交量,得到动态加权均价。
2. VWAP 的主要用途
用途:
1)判断市场公允价格
价格高于VWAP = 偏强;低于VWAP = 偏弱。
2)支撑/阻力参考
VWAP常作为短线交易的动态支撑/阻力位。
3)日内趋势确认
价格持续在VWAP上方 = 多头主导;下方 = 空头主导。
Riepilogo
VWAP serves several key functions: it acts as a reference for fair value, where prices above VWAP indicate bullish bias and below indicate bearish bias; it provides dynamic support and resistance levels useful for intraday breakouts and reversals; and it helps confirm intraday trends, with prices sustained above VWAP signaling an uptrend and below signaling a downtrend.
This indicator supports various markets including forex, stocks, indices, commodities, and cryptocurrencies, making it a versatile tool for intraday market analysis and trading strategy development.


