
Açıklama
UZATILMIŞ SÜRÜM MEVCUT — BURADA
Şu anda orijinal sürümü görüntülüyorsunuz. Bu göstergenin uzatılmış sürümü ek özelliklerle yayınlandı:
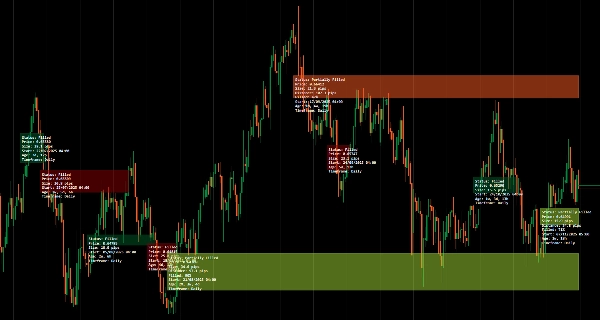
- Geliştirilmiş Yaş Gösterimi: Yıl, ay, hafta, gün formatı (örneğin, "3y 2w 4d")
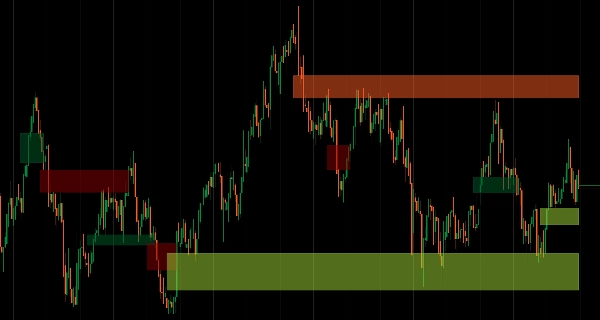
- Tüm FVG'leri Göster: Tarihsel sınırsız FVG göstermek için "Gösterilecek FVG" değerini -1 olarak ayarlayın
- Doldurulmuş FVG'leri Uzat: Doldurulmuş FVG kutularını mevcut bara uzatma seçeneği
- Fibonacci Seviyeleri: Kısmi ve doldurulmuş FVG'lerde otomatik seviyeler (23.6%, 38.2%, 50%, 61.8%, 78.6%)
- Kısmi Doldurma Eşiği: Özelleştirilebilir eşik (50-99%, varsayılan 90%)
__________________________________________________________________________________________
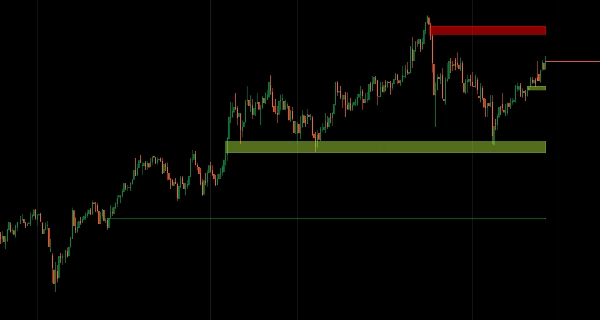
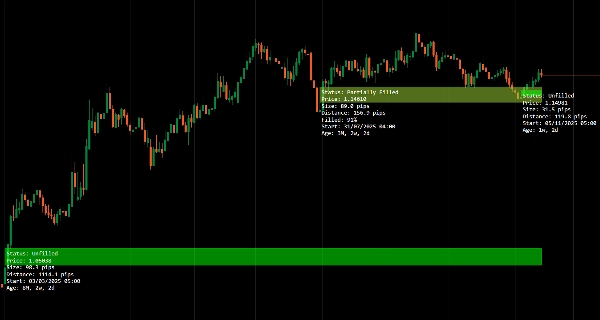
Yaş takibi ve doluluk durumu izleme ile Adil Değer Boşluklarını tanımlayın.
Otomatik olarak yükseliş ve düşüş boşluklarını algılar, doluluk davranışlarını (doldurulmamış, kısmen doldurulmuş, tamamen doldurulmuş) gerçek zamanlı olarak takip eder ve önceliklendirme için boşluk yaşını gösterir.
Çoklu zaman dilimi taraması ile YT yapısal boşluklarını AT fiyat hareketiyle hizalar, fiyatın bölgelerle etkileşimine göre dinamik durum güncellemeleri sağlar ve minimal müdahaleci etiketleme ile boşluk doldurma ve yapıya dayalı girişler hedefleyen tüccarlar için odaklanmış likidite dengesizliği analizi sunar.
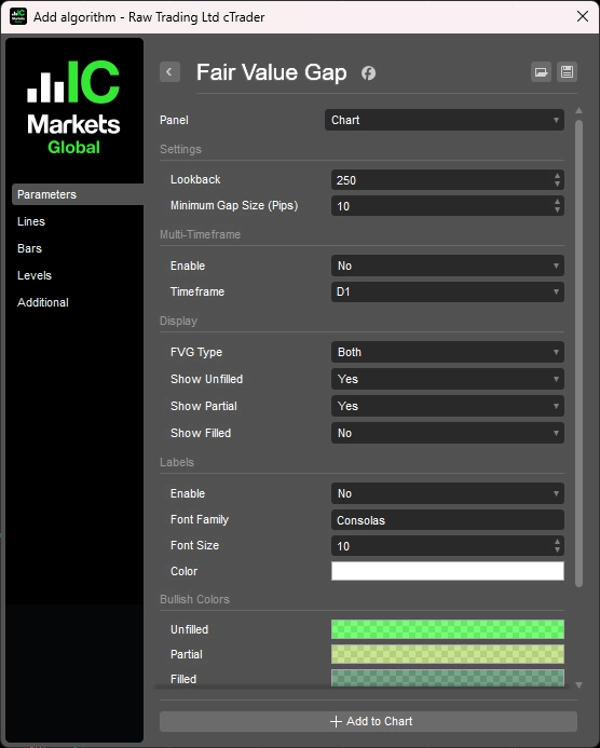
ÖZELLİKLER
FVG Tanımlama
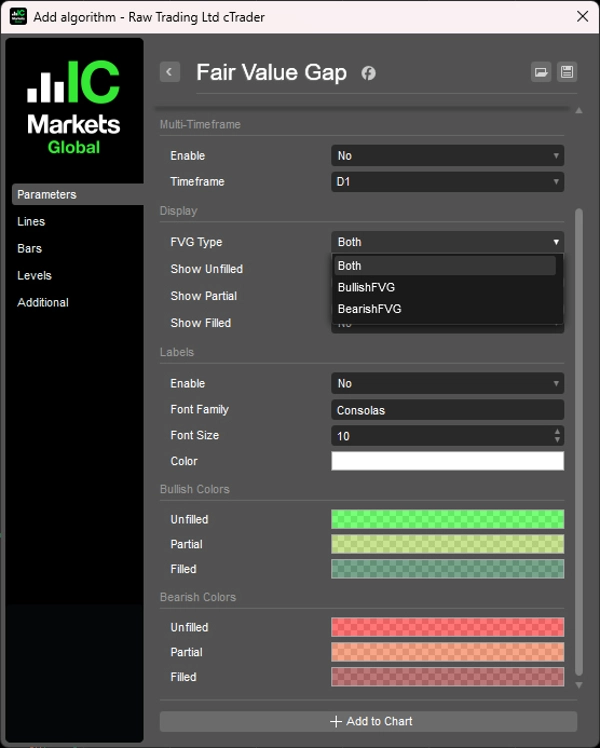
- Otomatik olarak yükseliş ve düşüş Adil Değer Boşluklarını algılar
- Doldurulmamış, kısmen doldurulmuş ve tamamen doldurulmuş durumları gerçek zamanlı takip eder
- Minimal grafik karmaşası ile temiz görsel çizim
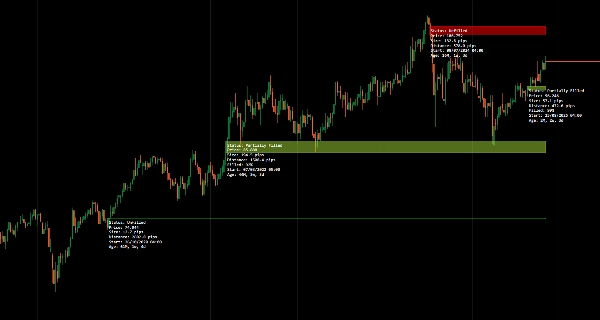
Yaş Etiketleme
- Her boşluğun oluşumundan bu yana geçen zamanı gösterir
- Taze ve eski boşlukların ticaret seçimi için önceliklendirilmesine yardımcı olur
- Zaman bağlamı, boşluk alaka düzeyi kararlarını geliştirir
Durum Takibi
- Mevcut doluluk durumunu gösterir: doldurulmamış, kısmen doldurulmuş veya tamamen doldurulmuş
- Fiyat boşlukla etkileşime girdikçe dinamik olarak güncellenir
- Likidite yakalama görsel onayı
Çoklu Zaman Dilimi Modu
- Daha yüksek zaman dilimi FVG'lerini daha düşük zaman dilimi grafiklerinde tarar ve gösterir
- YT yapısal boşluklarını AT fiyat hareketiyle hizalar
- Çoklu zaman dilimi analiz iş akışını geliştirir
Temiz, Minimal Kullanıcı Arayüzü
- Açıklık için tasarlanmış müdahaleci olmayan etiketler
- Fiyat görünümünüzü kalabalıklaştırmadan bilgilendirici
- Odaklanmış analiz için profesyonel sunum
__________________________________________________________________________________________
DAHA FAZLA ÜCRETSİZ GÖSTERGE
Yapı ve hacimden regresyon, volatilite ve özel zaman dilimlerine kadar geniş bir piyasa analiz araçları yelpazesini keşfedin.
Kaynak kodu GitHub deposunda mevcuttur.
Kullanımı tamamen ücretsizdir. Ancak kahve desteği göndermek isterseniz, buradan yönlendirebilirsiniz.
Destek/Direnç
Hacim
- Hacim Aktivite Profili
- Hacim Verimlilik Analizörü
- Hacim Profili Analitiği
- Hacim Profili - Güncellenmiş
- Hacim Yayılım Analizi
- VWAP (Hacim Ağırlıklı Ortalama Fiyat)
Hareketli Ortalamalar
- Çapa Hareketli Ortalama
- Sapma Ölçekli Hareketli Ortalama
- Anlık Trend Çizgisi
- Trend Vizyonlu Kaufman Adaptif MA
- Hareketli Ortalama Kanalı
- Hareketli Ortalamalar Paketi
- Trend Kanalı Hareketli Ortalama
Araçlar/Özel
Regresyon Tabanlı
Volatilite
Osilatörler
__________________________________________________________________________________________
FERAGATNAME
Ticaret risk içerir. Bu gösterge yalnızca teknik analiz amaçlıdır — her zaman uygun risk yönetimi uygulayın ve sorumlu şekilde işlem yapın.
GERİ BİLDİRİM & GELİŞTİRMELER
Önerileriniz, özellik talepleriniz veya geliştirme fikirleriniz varsa, lütfen Tartışma sekmesinde yorum bırakın. Geri bildiriminiz göstergenin herkes için iyileştirilmesine yardımcı olur.
Özet
Müşteri değerlendirmeleri
5 | 100 % | |
4 | 0 % | |
3 | 0 % | |
2 | 0 % | |
1 | 0 % |


