
Market Sessions_noSourceCode
Indicatore
272 download
Versione 1.0, Feb 2025
Windows, Mac
Descrizione
Riepilogo
Riepilogo AI
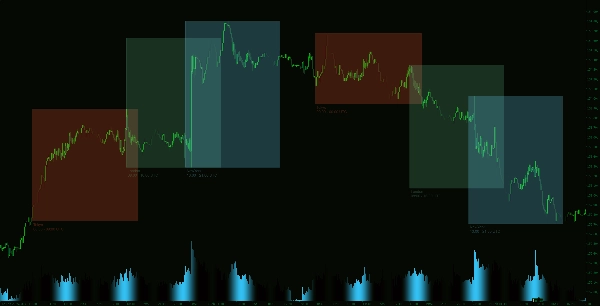
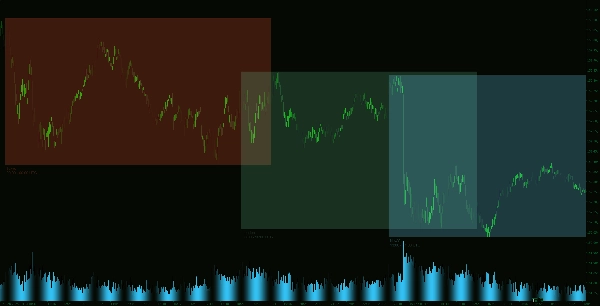
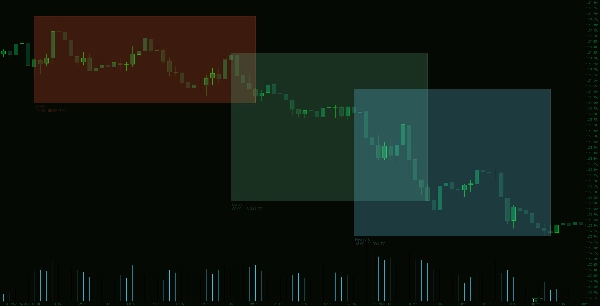
The Market Sessions Indicator is a trading tool designed to visually display the major market sessions—Tokyo, London, and New York—directly on trading charts. It highlights these sessions using customizable colors, allowing traders to tailor the appearance to their chart themes. The indicator draws rectangles representing each session’s high and low price ranges, providing a clear visual reference of market activity during these periods. Users can select how many previous days (up to 10) of session data to display, enhancing historical context. Additionally, the session highlights can be configured as filled or outlined rectangles, aiding in quick identification of active market zones. This indicator supports enhanced market session tracking to assist traders in analyzing price movements relative to global trading hours.
Profilo indicatore
Recensioni dei clienti
0.0
Recensioni: 0
Recensioni dei clienti
Questo prodotto non ha ancora ricevuto recensioni. L'hai già provato? Fallo sapere agli altri per primo!
Discussioni
Domande frequenti
I prodotti disponibili tramite cTrader Store, inclusi bot di trading, indicatori e plugin, sono forniti da sviluppatori terzi e resi disponibili esclusivamente a scopo informativo e di accesso tecnico. cTrader Store non è un broker e non fornisce consulenze in materia di investimento, raccomandazioni individualizzate o garanzie di risultati futuri.


Prezzo
Da 14/01/2025
55
Vendite
11.53K
Installazioni gratuite