
Descrizione
Sblocca una comprensione più profonda delle dinamiche del mercato Forex con l'indicatore completo Relative Currency Strength (RCS), progettato specificamente per la piattaforma cTrader.
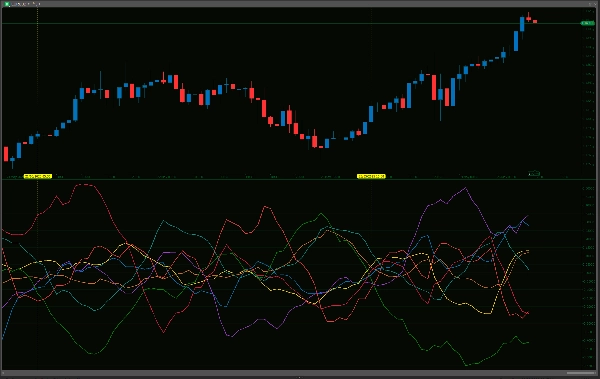
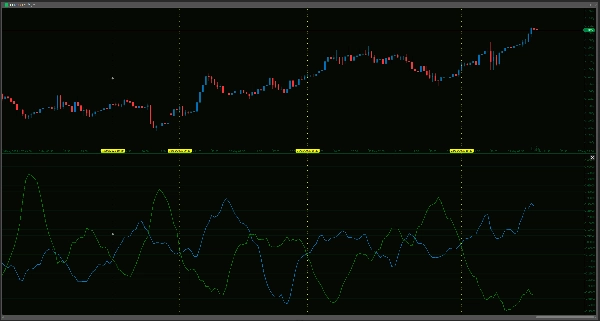
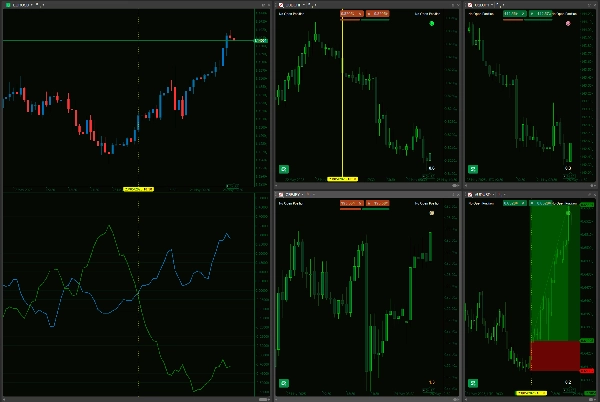
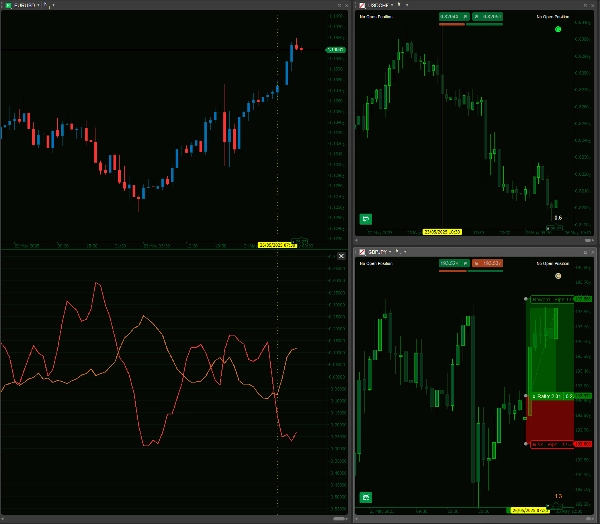
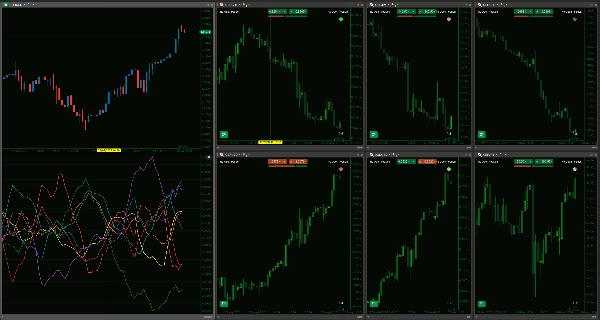
Questo potente strumento valuta meticolosamente la performance individuale di otto valute principali—AUD, USD, EUR, JPY, GBP, CAD, CHF e NZD—analizzando la loro variazione percentuale l'una rispetto all'altra attraverso un paniere di 28 coppie di valute. Con periodi di lookback e smoothing definiti dall'utente, puoi regolare la sensibilità dell'indicatore per allinearla al tuo approccio di trading unico, dallo scalping rapido a strategie a lungo termine. L'output visivo chiaro consente un confronto immediato e a colpo d'occhio, aiutandoti a identificare rapidamente le valute che mostrano un forte slancio rialzista o quelle che mostrano segni di debolezza, il che può essere fondamentale nella selezione delle coppie di valute con un potenziale maggiore per le tue strategie. Offre un modo per andare oltre l'analisi di una singola coppia e vedere il quadro più ampio di quali valute individuali stanno realmente guidando i movimenti del mercato.
È però cruciale utilizzare questo indicatore con una chiara comprensione delle sue capacità e limitazioni. L'indicatore RCS è uno strumento analitico sofisticato, non un dispositivo di previsione infallibile né un sistema di trading completo 'imposta e dimentica'. I suoi calcoli si basano su dati storici dei prezzi e sono intesi ad integrare, non sostituire, la tua metodologia di trading consolidata, che dovrebbe sempre includere un'analisi approfondita dell'azione del prezzo, la considerazione di fattori fondamentali e pratiche robuste di gestione del rischio. Sebbene la 'forza' o la 'debolezza' siano evidenziate dalle linee, queste letture richiedono un'interpretazione attenta nel contesto più ampio del mercato; per esempio, una valuta che mostra una 'forza' estrema potrebbe avvicinarsi a una condizione di ipercomprato o a un livello chiave di resistenza.
La performance dell'indicatore può anche variare con le condizioni di mercato prevalenti (ad esempio, può comportarsi diversamente in mercati fortemente trend rispetto a mercati laterali e instabili), e la sua accuratezza dipende dal fatto che la tua piattaforma disponga di dati storici sufficienti e puliti per tutte le 28 coppie di valute coinvolte. Pur essendo ottimizzato per calcoli continui, il caricamento iniziale dei dati per un'analisi così completa tra valute può essere impegnativo per le risorse della piattaforma, specialmente su connessioni lente o hardware meno potente. Fornendo una prospettiva sfumata e multi-valuta, questo indicatore RCS è offerto come un valido aiuto per aiutarti a prendere decisioni di trading più informate e strategicamente solide e potenzialmente migliorare il tuo vantaggio nell'arena competitiva del Forex, piuttosto che come una soluzione autonoma.
Si prega di verificare che il tuo broker offra tutte le coppie incrociate all'interno di questo indicatore affinché funzioni correttamente.
--------------------------
Sentiti libero di dare un'occhiata ai miei altri indicatori!
https://ctrader.com/products/1181
https://ctrader.com/products/1182
https://ctrader.com/products/1180
https://ctrader.com/products/1015
https://ctrader.com/products/555
https://ctrader.com/products/553
https://ctrader.com/products/554
https://ctrader.com/products/552
https://ctrader.com/products/557
https://ctrader.com/products/845
https://ctrader.com/products/848
https://ctrader.com/products/847
https://ctrader.com/products/846
https://ctrader.com/products/551
https://ctrader.com/products/574
https://ctrader.com/products/573
https://ctrader.com/products/556
https://ctrader.com/products/558
https://ctrader.com/products/559
https://ctrader.com/products/560
Riepilogo
The indicator provides a clear visual representation of currency strength and weakness, enabling traders to identify currencies with strong momentum or signs of weakness at a glance. This multi-currency perspective helps move beyond single-pair analysis to understand which currencies are driving market movements.
The tool relies on historical price data and requires all relevant currency pairs to be available from the broker. Its performance may vary with market conditions, and it is intended to complement, not replace, comprehensive trading strategies that include price action, fundamental analysis, and risk management. Initial data loading can be resource-intensive due to the breadth of cross-currency calculations.
This indicator serves as an analytical aid to support more informed Forex trading decisions by highlighting relative currency strength across major pairs.
Recensioni dei clienti
5 | 33 % | |
4 | 67 % | |
3 | 0 % | |
2 | 0 % | |
1 | 0 % |


![Logo di "Gaussian Channel [Iridio Capital]"](https://cdn.ctrader.com/image/webp/7c039209-5573-4a54-a072-f9528b503103_41960)

![Logo di "[Stellar Strategies] MARSI Signal Plotter"](https://cdn.ctrader.com/image/webp/7b2b8da6-8f8e-4646-8d4a-4710c516c01e_25567)

