Questo indicatore è progettato per eseguire un'analisi di regressione non lineare multipla utilizzando quattro variabili indipendenti: prezzi di chiusura, apertura, massimo e minimo.
Ecco i componenti e le funzionalità:
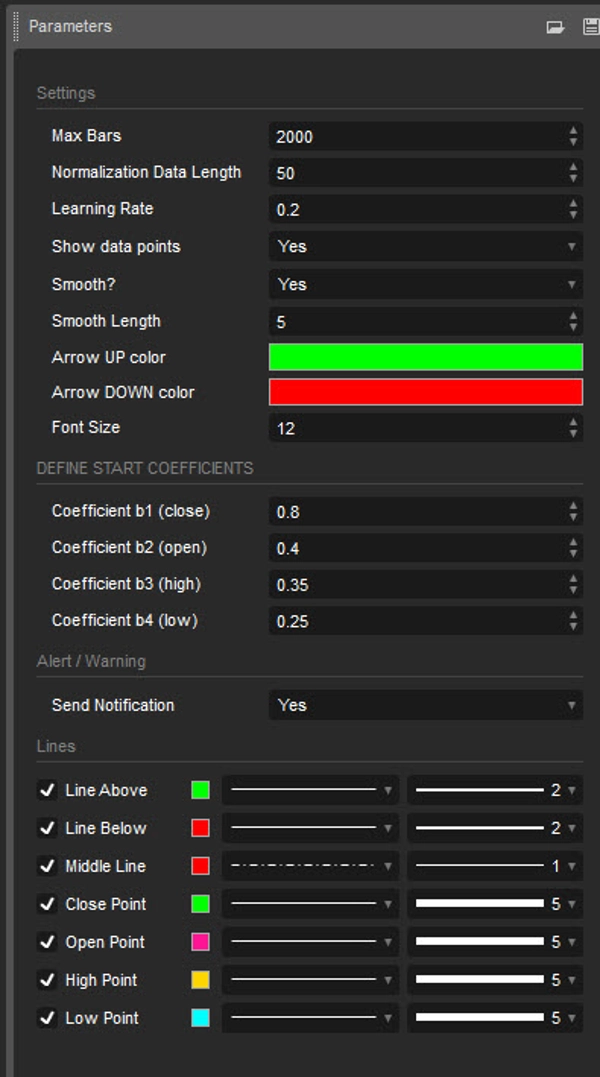
Input:
- Lunghezza dei dati per la normalizzazione: Lunghezza dei dati utilizzati per la normalizzazione.
- Tasso di apprendimento: Velocità con cui l'algoritmo apprende dagli errori.
- Mostra punti dati: Mostra la rappresentazione grafica dei dati di input normalizzati (chiusura, apertura, massimo, minimo)
- Liscia?: Opzione per lisciare l'output.
- Lunghezza della lisciatura: Lunghezza della lisciatura se abilitata.
- Definisci coefficienti iniziali: Coefficienti iniziali per l'equazione di regressione.
Normalizzazione dei dati:
Lo script normalizza i dati di input in un intervallo tra 0 e 1 utilizzando i valori più alti e più bassi all'interno di una lunghezza specificata.
Regressione non lineare:
Calcola l'equazione di regressione utilizzando i coefficienti di input e i dati normalizzati. L'equazione utilizzata è una somma ponderata delle variabili indipendenti, con coefficienti regolati iterativamente tramite discesa del gradiente per minimizzare gli errori.
Calcolo dell'errore:
Lo script calcola l'errore tra i valori effettivi e quelli previsti.
Discesa del gradiente:
I coefficienti vengono aggiornati iterativamente utilizzando la discesa del gradiente per minimizzare l'errore.
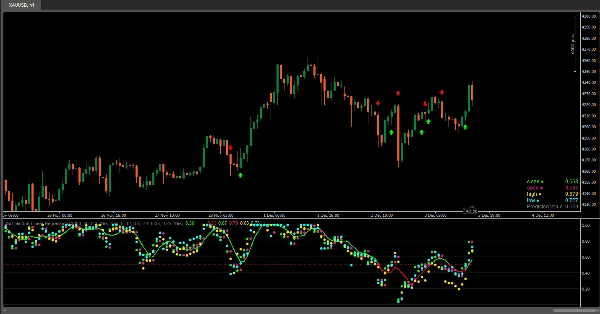
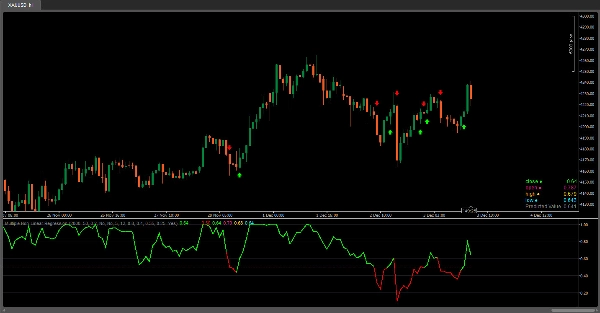
Visualizzazione:
- Rappresentazione grafica dei dati di input normalizzati (chiusura, apertura, massimo, minimo).
- L'indicatore fornisce la visualizzazione dei valori dei dati normalizzati (chiusura, apertura, massimo, minimo) sotto forma di marcatori circolari sul grafico, permettendo agli utenti di osservare facilmente le posizioni relative di questi valori rispetto tra loro e alla linea di regressione.
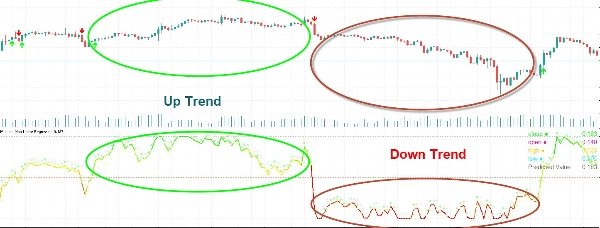
- Rappresentazione grafica della linea di regressione.
- Gradiente di colore sulla linea di regressione basato sul suo valore e sui colori delle barre.
- Visualizzazione dei dati di input normalizzati e del valore previsto in una tabella.
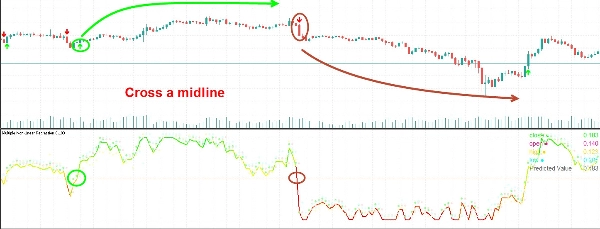
- Segnali per incroci con una linea mediana (0,5).
Interpretazione:
Gli utenti possono interpretare la linea di regressione e i suoi incroci con la linea mediana (0,5) come segnali per potenziali opportunità di acquisto o vendita.
Questo indicatore aiuta gli utenti ad analizzare la relazione tra più variabili e a prendere decisioni di trading basate sull'analisi di regressione. Regolare i coefficienti e i parametri può perfezionare le prestazioni del modello in base a specifiche condizioni di mercato.
5 | 100 % | |
4 | 0 % | |
3 | 0 % | |
2 | 0 % | |
1 | 0 % |