
Simple ICT Concepts
Indicador
3 compras
Versão 1.0, Dec 2025
Windows, Mac
4.0
Avaliações: 1
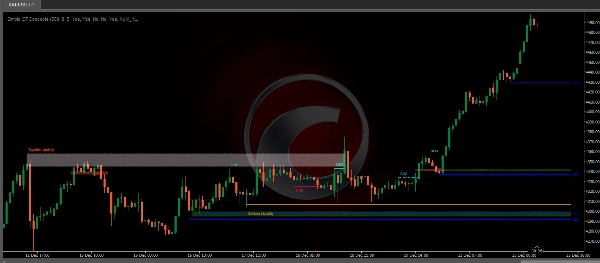
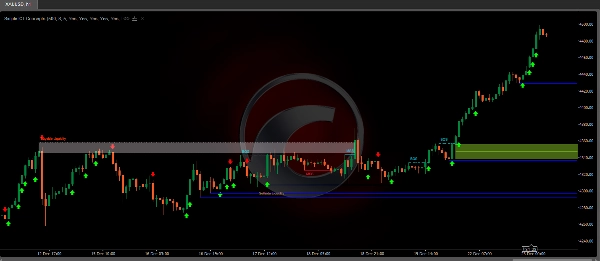
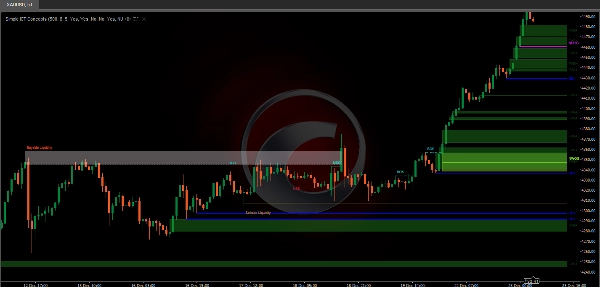
O Indicador Simple ICT Concepts é uma ferramenta poderosa projetada para ajudar os traders a aplicar os princípios da metodologia Inner Circle Trader (ICT). Este indicador foca na identificação de zonas-chave, como níveis de liquidez, suporte e resistência, e estrutura de mercado, tornando-se um recurso inestimável para traders de price action e conceitos de smart money.
Principais Características
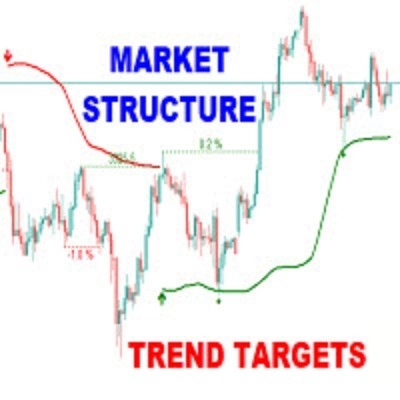
Estrutura de Mercado:
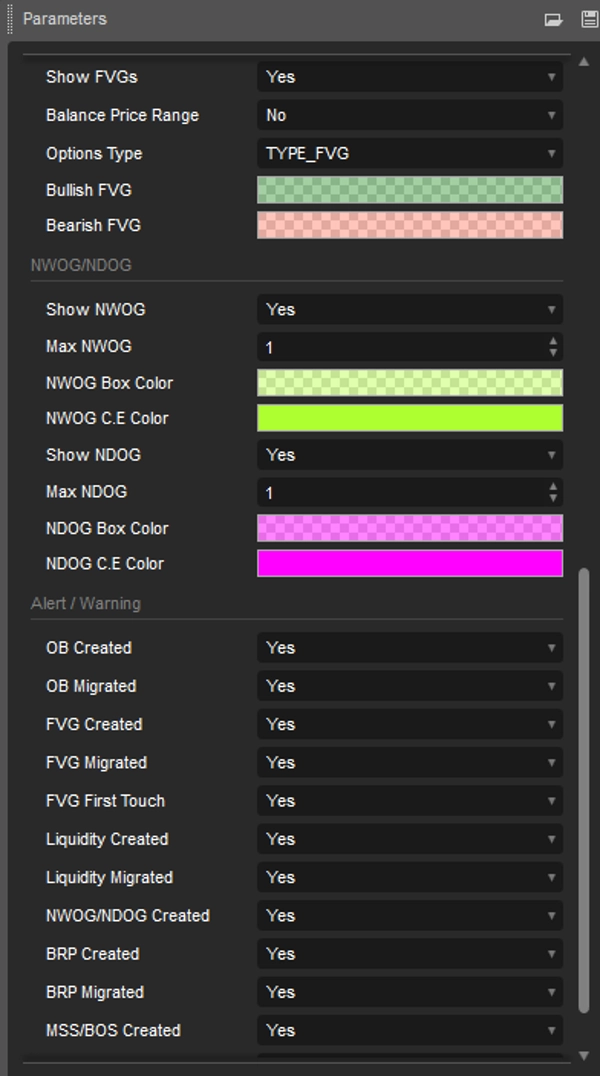
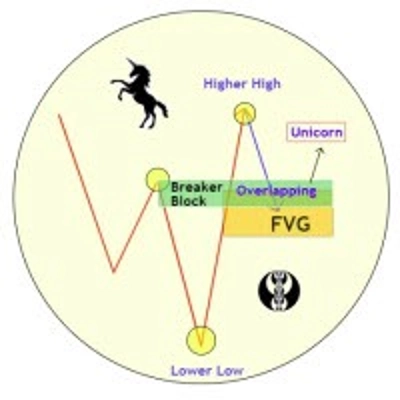
As etiquetas de estrutura de mercado são construídas a partir da quebra de um ponto de oscilação anterior pelo preço. Isso permite que o usuário determine a tendência atual do mercado com base na ação do preço.Existem dois tipos de etiquetas de Estrutura de Mercado incluídas:Mudança de Estrutura de Mercado (MSS)Quebra de Estrutura (BOS)Uma MSS ocorre quando o preço quebra uma mínima de oscilação em uma tendência de alta ou uma máxima de oscilação em uma tendência de baixa, destacando uma possível reversão.Isso é frequentemente rotulado como "CHoCH", mas o ICT especifica como MSS. Por outro lado, as etiquetas BOS ocorrem quando o preço quebra uma máxima de oscilação em uma tendência de alta ou uma mínima de oscilação em uma tendência de baixa.A ocorrência desses pontos de oscilação específicos é causada por retrações (induzimentos) que destacam a caça à liquidez em timeframes inferiores.Pontos-chave de oscilação: Máximas mais altas (HH) e mínimas mais baixas (LL), mínimas mais altas (HL) e máximas mais baixas (LH)Deslocamento:Deslocamentos são cenários onde o preço forma velas sucessivas do mesmo sentimento (altista/baixista) com corpos grandes e sombras curtas.Estes podem ser mais tecnicamente identificados por autocorrelação positiva (uma mudança de fechamento para abertura tem maior probabilidade de ser seguida por uma mudança do mesmo sinal) assim como agrupamento de volatilidade (grandes mudanças são seguidas por grandes mudanças).Deslocamentos podem ser a causa para a formação de desequilíbrios assim como da estrutura de mercado, estes podem ser causados pela execução completa de uma meta ordem.Desequilíbrio de Volume:Um Desequilíbrio de Volume (V.I.) ocorre quando há uma área de preço que ficou sem corpo de vela. Há movimento para cima e para baixo na sobreposição das sombras, porém, como a maior parte do volume está no corpo da vela, chamamos isso de Desequilíbrio de Volume.Blocos de Ordem:Um bloco de ordem ICT (Inner Circle Trader) é uma área de preço em um gráfico onde grandes investidores institucionais colocam ordens significativas de compra ou venda. Blocos de ordem são um conceito chave no trading, pois podem ajudar os traders a identificar potenciais níveis de suporte e resistência, e antecipar reversões de preço.Liquidez:Níveis de liquidez do lado comprador/vendedor destacam níveis de preço onde participantes do mercado podem colocar ordens limit/stop.Níveis de liquidez do lado comprador reúnem as ordens de stop-loss dos traders vendidos assim como ordens limit dos traders comprados, enquanto níveis de liquidez do lado vendedor reúnem as ordens de stop-loss dos traders comprados assim como ordens limit dos traders vendidos.Esses níveis podem desempenhar diferentes papéis. Participantes do mercado mais informados podem ver esses níveis como fonte de liquidez, e uma vez que a liquidez acima de um nível específico é reduzida, ela será encontrada em outra área.FVG/IFVG:Gaps de Valor Justo: Uma formação de três velas onde as sombras das velas adjacentes à vela central não se sobrepõem, destacando uma área de gap.Gaps de Valor Justo Implícitos: Ao contrário do gap de valor justo, o gap de valor justo implícito tem sombras das velas adjacentes à vela central se sobrepondo. A área do gap é construída a partir da média entre a respectiva sombra e a extremidade mais próxima do corpo da vela.Faixa de Preço Balanceada: Faixas de preço balanceadas ocorrem quando um gap de valor justo se sobrepõe a um gap de valor justo anterior, com a área sobreposta resultando na área de desequilíbrio.NWOG/NDOG:Este indicador revela os gaps de abertura da nova semana (NWOG) e os gaps de abertura do novo dia (NDOG). O NWOG é o gap entre o preço de fechamento de sexta-feira e o preço de abertura de domingo. O NDOG é o gap entre o preço de abertura e o preço de fechamento do dia anterior.
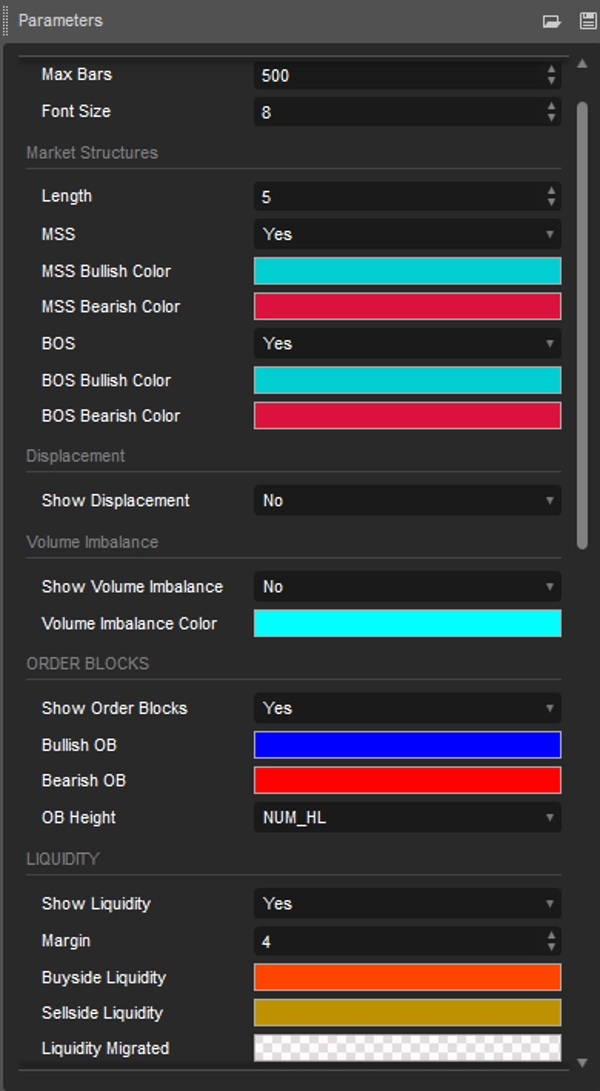
Recursos Personalizáveis
Os usuários podem ajustar configurações como comprimento dos dados, cores e estilos de exibição para combinar com suas preferências de trading.
Benefícios para Traders
Economiza tempo na análise manual, aumentando a eficiência do trading.
Ajuda a tomar decisões rápidas e informadas durante condições voláteis do mercado.
Fácil de usar tanto para iniciantes quanto para traders experientes.
Conclusão
O Indicador Simple ICT Concepts não é apenas uma ferramenta, mas uma solução abrangente para traders que buscam implementar efetivamente estratégias ICT. É uma escolha robusta para aprimorar a análise de mercado e executar trades precisos.
Perfil do indicador
4.0
Avaliações: 1
5 | 0 % | |
4 | 100 % | |
3 | 0 % | |
2 | 0 % | |
1 | 0 % |
Avaliações de clientes
December 27, 2025
The signal still needs a chart check, no surprise there. One green trade proves nothing.
BTCUSD
Forex
Signal
Fair Value Gap
Crypto
XAUUSD
NAS100
Os produtos disponíveis através da cTrader Store, incluindo bots de negociação, indicadores e plugins, são fornecidos por programadores terceiros e são disponibilizados apenas para fins informativos e de acesso técnico. A cTrader Store não é um corretor e não fornece aconselhamento em matéria de investimento, recomendações pessoais ou qualquer garantia de desempenho no futuro.


36
Vendas
2.23K
Instalações gratuitas