
Descrição
Perfil de Volume da Sessão HD
O Que Faz
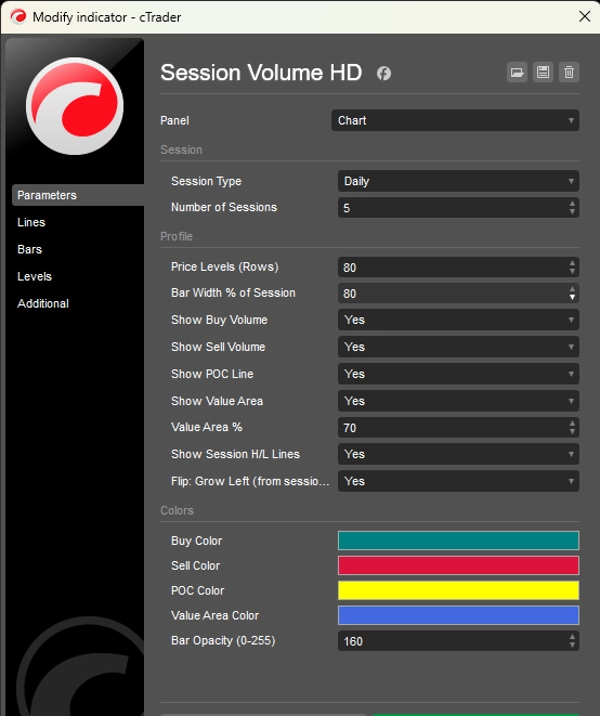
Exibe um perfil de volume horizontal para cada sessão de negociação diretamente no gráfico. Mostra como o volume de negociação está distribuído pelos níveis de preço, ajudando os traders a identificar zonas de alta atividade, áreas de valor justo e níveis-chave de suporte/resistência derivados puramente do comportamento do volume.
Como Funciona
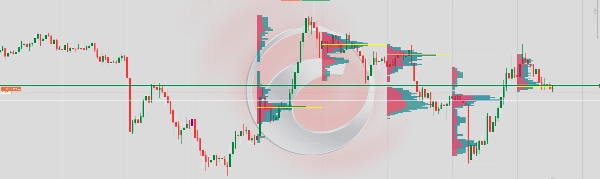
A cada fechamento de nova barra, o indicador escaneia todas as barras dentro do número definido de sessões e distribui o volume de ticks de cada barra ao longo de sua faixa de preço. O volume é dividido em lado de compra (barras altistas) e lado de venda (barras baixistas) usando a direção de abertura/fechamento da barra como proxy. O resultado é renderizado como um histograma horizontal em camadas ancorado ao limite temporal da sessão.
Elementos Visuais
Barras de Compra (Verde-azulado) — Mostram o volume negociado em movimento de preço altista em cada nível. Crescem para a esquerda (ou para a direita se invertido) a partir da âncora da sessão.
Barras de Venda (Vermelho) — Mostram o volume negociado em movimento de preço baixista em cada nível, empilhadas ao lado das barras de compra.
Linha POC (Amarela) — Ponto de Controle. Uma linha horizontal que marca o nível de preço com o maior volume total na sessão. Atua como um ímã para o preço.
Área de Valor (Sobreposição Azul) — A faixa de preço que contém uma porcentagem configurável (padrão 70%) do volume total da sessão. Representa a zona de "valor justo" onde ocorreu a maior parte das negociações.
Linhas H/L da Sessão (Branco pontilhado) — Marcam o preço mais alto e mais baixo alcançado durante a sessão.
Desempenho
O indicador redesenha apenas uma vez por nova barra, não a cada tick. Isso elimina o flickering e garante uma renderização estável mesmo com muitas sessões e alta contagem de níveis de preço.
Limitações
Como o cTrader não expõe o volume real de bid/ask no nível da barra sem um feed de dados tick, o volume de compra/venda é aproximado usando a direção da barra: barras altistas são ponderadas 65% compra / 35% venda, barras baixistas o inverso, e barras doji são divididas 50/50. Para volume delta verdadeiro seria necessária uma assinatura de dados tick.


![Logótipo de "Wyckoff Toolkit [Iridio Capital]"](https://cdn.ctrader.com/image/webp/8acfe6a1-6a8e-4578-9367-9df3af2b1801_27763)


