
Descrição
Níveis de Liquidez NGS – Máximos e Mínimos Diários • Semanais • Mensais
Negocie em torno da liquidez, não em torno de linhas aleatórias.
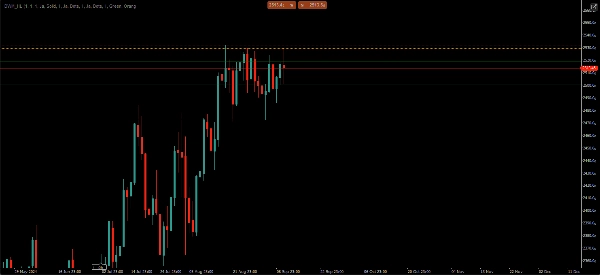
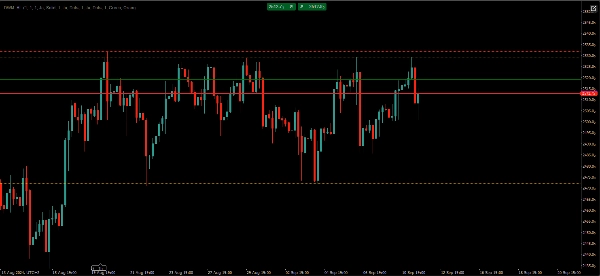
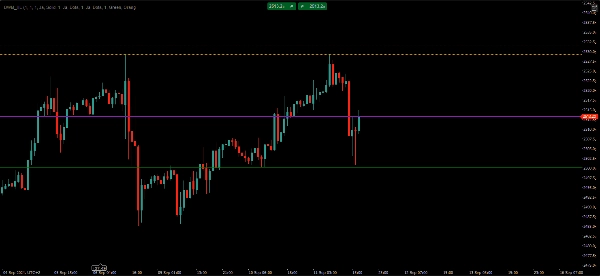
Níveis de Liquidez NGS exibe automaticamente os níveis de liquidez Diários, Semanais e Mensais mais importantes em cada gráfico.
• Sem desenho manual
• Sem troca de período de tempo
• Sem poluição no gráfico
Este indicador fácil de usar ajuda os traders a identificar níveis-chave de liquidez e estrutura de mercado em segundos. Em vez de marcar manualmente máximos e mínimos todos os dias, os níveis mais importantes são exibidos e atualizados automaticamente para você.
Características:
• Níveis automáticos de Máximo e Mínimo Diários
• Níveis automáticos de Máximo e Mínimo Semanais
• Níveis automáticos de Máximo e Mínimo Mensais
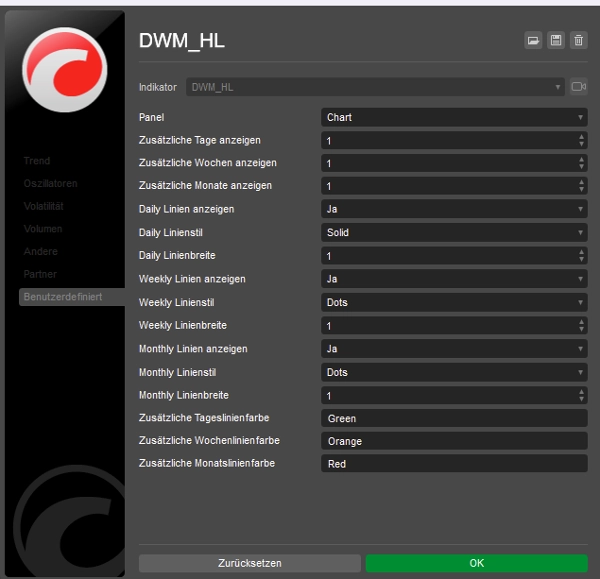
• Níveis opcionais do período anterior
• Cores e estilos de linha personalizáveis
• Exibição limpa e leve no gráfico
• Funciona em Forex, Índices, Commodities e Cripto
• Suporta múltiplos períodos de tempo
• Não repinta
Projetado para traders que focam na estrutura do mercado, liquidez e níveis de períodos maiores.
Sem sinais.
Sem estratégia.
Sem promessas de lucro.
Apenas níveis objetivos de liquidez e um fluxo de trabalho de negociação mais limpo.
Resumo
Avaliações de clientes
5 | 100 % | |
4 | 0 % | |
3 | 0 % | |
2 | 0 % | |
1 | 0 % |


