
الوصف
🌊 Tsunami Volume Surge (RVOL + Time-of-Day) هو أداة حجم دقيقة لـ cTrader تُظهر لك متى يكون السوق نشطًا حقًا.
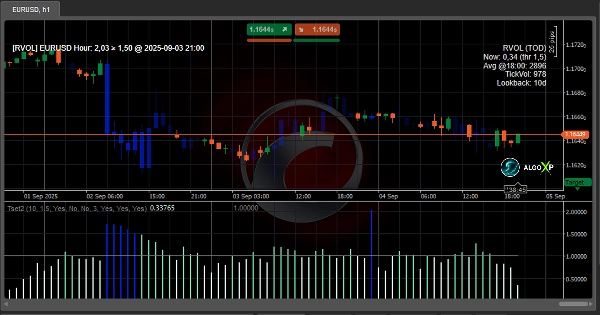
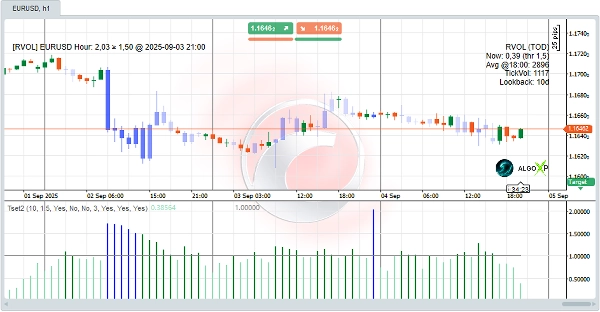
بدلاً من النظر إلى الحجم الخام، يقارن تسونامي نشاط كل شريط بـ المتوسط في نفس وقت اليوم خلال أيام المراجعة التي تختارها. يكشف هذا التطبيع حسب وقت اليوم عن ارتفاعات المشاركة الحقيقية التي يمكنك التداول عليها: اعتبر 1.0 كـ "طبيعي"، واستخدم 1.5–2.0 لتأكيد الاختراقات، وراقب 3.0+ للحركات الانفجارية للأخبار. مخطط RVOL نظيف، تلوين الشموع الديناميكي، و التنبيهات والنوافذ المنبثقة تجعل الطاقة واضحة من النظرة الأولى - خفيف وسريع على M1–M15 عبر الفوركس، العملات المشفرة، والمؤشرات. يمكن أيضًا استخدام قيم RVOL لتغذية cBots كمرشح بسيط وقوي.
استكشف المزيد من الموارد والأسئلة الشائعة التفصيلية على AlgoXP
⚡ كيفية التداول بها (بدء سريع)
- أضف تسونامي على الرسم البياني الخاص بك (M1–M15 يعمل بشكل رائع). اضبط أيام المراجعة (ابدأ بـ 20–30).
- احتفظ بـ الخط الأساسي 1.0 مرئيًا. RVOL < 1.0 = هادئ؛ ≥ 1.5–2.0 = تأكيد الاختراقات؛ ≥ 3.0 = ارتفاع الأخبار.
- قم بتشغيل تمكين التنبيهات واختر التنبيه عند الإغلاق فقط (أكثر أمانًا) أو داخل الشمعة (أسرع).
- استخدم تلوين الأشرطة لقراءة فورية للطاقة؛ اضبط لون الشريط حسب الذوق.
- (اختياري) في cBots، اقرأ سلسلة RVOL لـ تصفية الإشارات للنوافذ النشطة فقط.
🚀 النتيجة: يحول تسونامي الحجم إلى ميزة واعية بالوقت - مساعدتك على تخطي الفترات الميتة، تأكيد الاختراقات الحقيقية، و التفاعل بشكل أسرع عندما يستيقظ السوق.
الملخص
Key features include an RVOL histogram, dynamic candle coloring for quick visual assessment, and customizable alerts with pop-ups. It operates efficiently on short timeframes (M1 to M15) and supports multiple markets such as Forex, cryptocurrencies, indices, commodities, and stocks. Additionally, RVOL values can be integrated into cBots as filters to refine automated trading signals.
The indicator aims to provide a time-aware volume edge, enabling traders to avoid low-activity periods, confirm breakouts, and respond promptly to market surges. Users can adjust settings like lookback days, alert preferences, and bar colors to tailor the tool to their trading style.
تقييمات العملاء
5 | 67 % | |
4 | 33 % | |
3 | 0 % | |
2 | 0 % | |
1 | 0 % |


