
Descrição
O Indicador Break of Structure (BoS CHoCH) é uma ferramenta inteligente de estrutura de mercado projetada para ajudar os traders a identificar facilmente continuações de tendência e reversões de tendência em tempo real. Ao detectar automaticamente os pontos altos e baixos oscilantes, esta ferramenta identifica Break of Structure (BoS) e Change of Character (ChoCh) — fornecendo sinais de negociação claros e acionáveis com marcadores visuais diretamente no seu gráfico.
🔎 Como Funciona
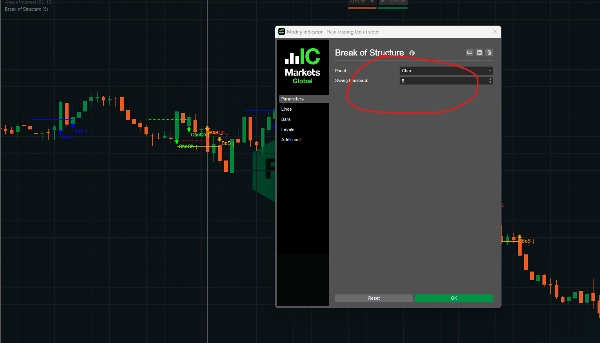
- Usa um período de retrocesso para detectar pontos altos/baixos oscilantes.
- BoS e ChoCh são detectados comparando o preço atual com pontos de estrutura anteriores.
- Quando ChoCh é confirmado (o preço rompe o LH ou HL anterior), um sinal de negociação é acionado.
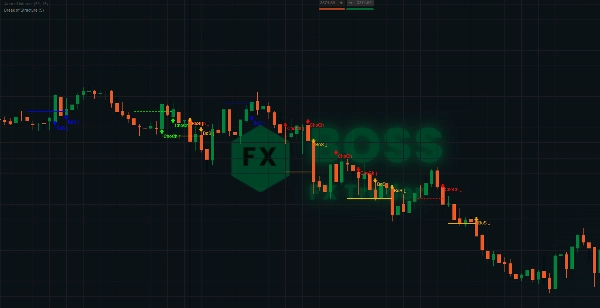
- Break of Structure (BoS): Mostrado com um rótulo e seta (continuação da tendência).
- Change of Character (ChoCh): Mostrado com um rótulo e seta diferentes (reversão da tendência).
- A detecção de pontos altos/baixos oscilantes é usada para rastrear e atualizar pontos de estrutura dinamicamente.
⚡ Recursos do Indicador
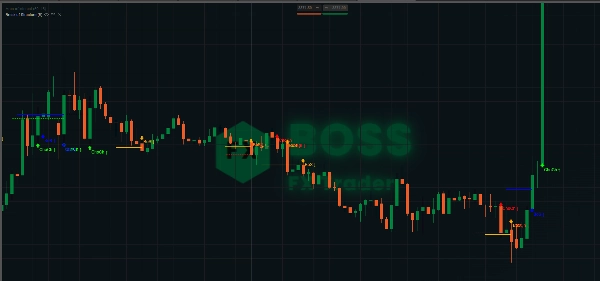
- ✅ Detecção de BoS: Marca quando o preço rompe uma Alta Mais Alta (HH) ou Baixa Mais Baixa (LL) recente.
- ✅ Detecção de ChoCh: Marca quando o preço rompe uma Alta Mais Baixa (LH) ou Baixa Mais Alta (HL).
- ✅ Rótulos Visuais & Setas: Sinais fáceis de ler plotados diretamente no gráfico.
- ✅ Rastreamento de Tendência: Simplifica a identificação de mudanças na estrutura do mercado.
O Indicador BoS da BossFXTrader oferece aos traders uma vantagem visual para entender a ação do preço. Quer você esteja negociando continuações ou reversões, esta ferramenta destaca momentos críticos na estrutura do mercado para que você possa entrar nas negociações com confiança.
Resumo
Avaliações de clientes
5 | 100 % | |
4 | 0 % | |
3 | 0 % | |
2 | 0 % | |
1 | 0 % |


