

Descrição
1️⃣ O que este indicador faz?
Esta ferramenta resume a direção das velas em múltiplos períodos de tempo em um só lugar no seu gráfico.
Para cada período de tempo, verifica a última vela fechada e exibe:
StatusSignificado
🟢 Alta
Fechamento > Abertura (compradores no controle)
🔴 Baixa
Fechamento < Abertura (vendedores no controle)
⚪ Doji
Fechamento ≈ Abertura (indecisão)
Períodos exibidos:
- Diário
- H4
- H1
- M30
- M15
- M5
Todos os status são mostrados no próprio gráfico, assim você não precisa mudar de período.
2️⃣ Por que esta ferramenta é poderosa
🔥 Resolve um problema comum dos traders
A maioria dos traders pergunta:
“Estou negociando com ou contra a tendência do período maior?”
Este indicador responde isso instantaneamente.
Em vez de adivinhar:
- Você vê alinhamento de tendência
- Você evita entradas contra a tendência
- Você melhora o timing e a confiança
3️⃣ Como o indicador funciona
📌 Lógica do status da vela
- Usa a última vela fechada (
Last(1)) - Sem repintura
- Confirmação confiável
📌 Dados Multi-Período
- Busca dados reais das velas de cada período
- Independente do período do gráfico em que você está
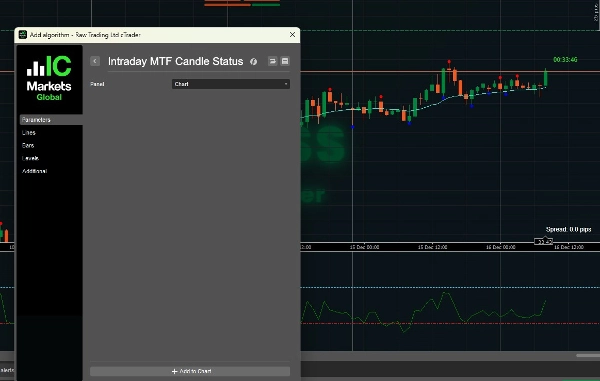
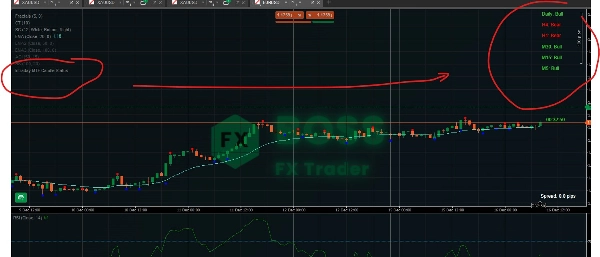
📌 Exibição no gráfico
- Desenha rótulos de texto na área superior direita
- Codificado por cores para leitura instantânea
- Atualizado a cada tick
4️⃣ Como usá-lo efetivamente (cenários de negociação)
🟢 Cenário 1: Confirmação de tendência (melhor caso de uso)
✔ Regra:
Negocie somente quando os períodos maiores e menores concordarem
Exemplo:
Diário: Alta
H4: Alta
H1: Alta
M15: Alta
M5: Alta
✅ Ambiente de COMPRA de alta probabilidade
Use:
- Pullbacks
- Breakouts
- Entradas de continuação
❌ Evite VENDAS aqui
🔴 Cenário 2: Aviso de contra-tendência
Diário: Alta
H4: Alta
H1: Baixa
M15: Baixa
M5: Baixa
⚠️ O mercado está em um pullback, não em reversão.
Melhores ações:
- Espere M5/M15 voltar a ser Alta
- Evite correr atrás de VENDAS
- Procure configurações de compra no suporte
⚪ Cenário 3: Mercado instável / lateralizado
Diário: Alta
H4: Doji
H1: Doji
M15: Baixa
M5: Alta
🚫 Condições de baixa qualidade
Recomendado:
- Reduza o tamanho da posição
- Evite negociações de breakout
- Espere clareza na estrutura
5️⃣ Exemplo de estratégia de scalping (entradas M5)
🔹 Configuração ideal de compra
- Diário → Alta
- H4 → Alta
- H1 → Alta
- M15 → Alta
- M5 → Baixa → vira Alta
📍 Entrada:
- Quando M5 voltar para Alta
- Combine com:
-
- Suporte
- Fractais
- EMA / VWAP
🔹 Configuração ideal de venda
Lógica oposta:
- Períodos maiores → Baixa
- Entre na conclusão do pullback no M5
6️⃣ Melhores combinações de períodos
Estilo de negociaçãoPeríodos focados
Scalping
H1 → M15 → M5
Intraday
H4 → H1 → M15
Swing
Diário → H4 → H1
7️⃣ O que esta ferramenta NÃO é
🚫 Não é um sinal de entrada por si só
🚫 Não é um indicador de reversão
🚫 Não substitui estrutura / ação de preço
✅ É uma ferramenta de viés e confirmação
8️⃣ Melhores indicadores para combinar
Combinações altamente recomendadas:
- ✅ Fractais (você já usa isso)
- ✅ Estrutura de mercado (HH / LL)
- ✅ Suporte e Resistência
- ✅ EMA 50 / EMA 200
- ✅ VWAP
9️⃣ Regras profissionais de negociação usando esta ferramenta
✔ Negocie somente na direção do período maior
✔ Use o período menor apenas para timing de entrada
✔ Ignore sinais quando Diário e H4 discordarem
✔ Não exagere nas negociações durante sinais mistos
✔ Deixe a estrutura confirmar o viés da vela
🔟 Resumo final
IntradyMultiTimeframeCandleStatus = Painel de Viés de Mercado
Ele oferece:
- Clareza instantânea da tendência
- Negociações com maior probabilidade
- Decisões menos emocionais
- Execução mais limpa
Confira nosso produto.
Resumo
Avaliações de clientes
5 | 100 % | |
4 | 0 % | |
3 | 0 % | |
2 | 0 % | |
1 | 0 % |


