
KANDIKA HEAT MAP
Indicador
1 compras
Versão 1.0, Jul 2025
Windows, Mac
4.6
Avaliações: 3
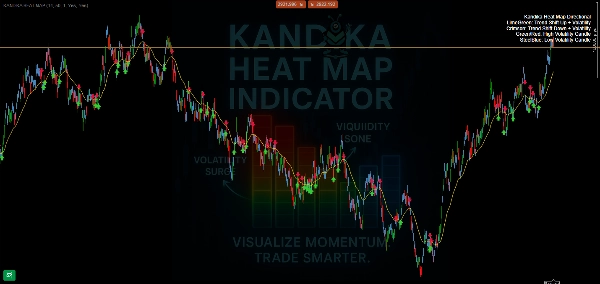
🎨 Lógica das Cores – O Que Ela Te Diz
- 🟩 Verde Lima → Mudança de Tendência para Cima
Uma mudança de momentum altista está se formando. Use-a para aproveitar a alta antecipada. - 🟥 Carmesim → Mudança de Tendência para Baixo
Sinaliza pressão de baixa aumentando. Prepara você para possíveis posições vendidas ou saídas. - 🟧/🔴 Laranja/Vermelho → Zona de Alta Volatilidade
Espere picos de preço, movimentos rápidos e possíveis armadilhas. Não é lugar para adivinhar às cegas—confirme sua estratégia. - 🟦 Azul Aço → Zona de Baixa Volatilidade
O mercado está desacelerando, comprimindo ou em consolidação. Frequentemente prepara oportunidades de rompimento.
📊 O Que Faz (E O Que Não Faz)
- ✅ Mapeia claramente mudanças na direção da tendência
- ✅ Separa visualmente zonas calmas e voláteis
- ✅ Sobreposição simples e amigável para gráficos—sem confusão
Perfil do indicador
4.6
Avaliações: 3
5 | 67 % | |
4 | 33 % | |
3 | 0 % | |
2 | 0 % | |
1 | 0 % |
Avaliações de clientes
August 4, 2025
No reason to yolo this live without a few normal sessions, and Bad settings can ruin the idea.
July 26, 2025
20 percent less clicking is the line to watch. Market checks feel quicker.
Os produtos disponíveis através da cTrader Store, incluindo bots de negociação, indicadores e plugins, são fornecidos por programadores terceiros e são disponibilizados apenas para fins informativos e de acesso técnico. A cTrader Store não é um corretor e não fornece aconselhamento em matéria de investimento, recomendações pessoais ou qualquer garantia de desempenho no futuro.


Desde 08/06/2025
1
Vendas