
الوصف
ما الذي يفعله
متوسط الحركة سوبرتريند يعالج قيدًا أساسيًا في المتوسطات المتحركة التقليدية: الفترات الثابتة التي لا تتكيف أبدًا مع كيفية تطور الاتجاهات فعليًا.
الفترات القصيرة تتفاعل بسرعة لكنها تتعرض للتقلبات. الفترات الطويلة تُخفف الضوضاء لكنها تتأخر بشدة خلال التحركات القوية. بغض النظر عن الإعداد، أنت مضطر لتخمين رقم وتأمل أن يتعاون السوق.
هذا المؤشر يزيل تلك التخمينات.
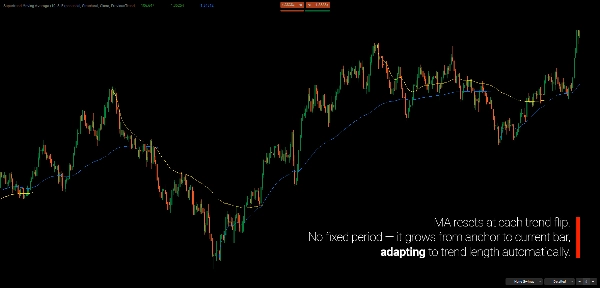
بدلاً من حساب متوسط السعر على عدد عشوائي من الأعمدة، يحسب المتوسط المتحرك من اللحظة التي يبدأ فيها الاتجاه الحالي هيكليًا. كلما طال الاتجاه، أصبح المتوسط المتحرك أطول بشكل طبيعي. الاتجاهات القصيرة تبقى سريعة الاستجابة. الاتجاهات الممتدة تصبح أكثر سلاسة — تلقائيًا.
النتيجة هي متوسط متحرك ينمو مع الاتجاه، وليس ضده.
مرتكز على التغيرات الهيكلية المستندة إلى سوبرتريند، يتكيف هذا المتوسط المتحرك مع إيقاع السوق في الوقت الحقيقي، بدون تحسين، أو ملائمة منحنيات، أو ضبط يدوي. الهيكل يحدد الفترة — وليس المتداول.
لماذا سوبرتريند الهيكلي؟
سوبرتريند الأصلي يغير الاتجاه عندما يغلق السعر خارج نطاقه. هذا يعمل جيدًا في الاتجاهات النظيفة لكنه يسبب إحباطًا شائعًا: إشارات خاطئة خلال الظروف المتقلبة.
المشكلة
شمعة متقلبة واحدة تغلق قليلاً خارج النطاق تؤدي إلى تغيير الاتجاه — حتى عندما يبقى الاتجاه الأوسع سليمًا. المتداولون الذين يتبعون سوبرتريند الأصلي غالبًا ما يواجهون:
- تقلبات خلال التوحيد
- خروج مبكر من اتجاهات صحيحة
- إعادة دخول بأسعار أسوأ بعد انعكاسات خاطئة
الحل
سوبرتريند الهيكلي يوسع مفهوم سوبرتريند الأصلي ليعكس بشكل أفضل التحولات الهيكلية بدلاً من التقلب اللحظي. يقوم بتصفية الضوضاء من خلال انتظار التأكيد على حدوث تغيير اتجاهي حقيقي.
النتيجة هي تقليل الإشارات الخاطئة وتحسين التوافق مع التغيرات الفعلية في الاتجاه.
لماذا نحتفظ بكليهما؟
سوبرتريند الأصلي ليس عديم الفائدة — إنه يجيب على سؤال مختلف.
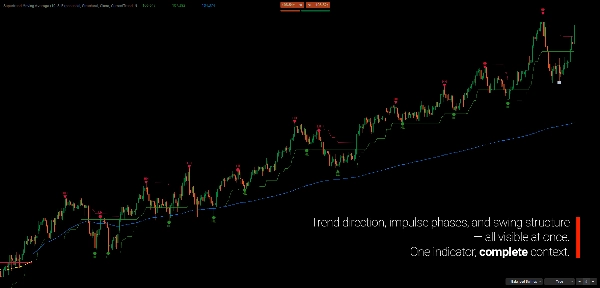
- الهيكلي يظهر الاتجاه الرئيسي (الصورة الكبيرة)
- الأصلي يظهر تحولات الزخم داخل ذلك الاتجاه (اندفاع مقابل تصحيح)
عندما تتوافق الخطوط: قناعة اتجاهية قوية. عندما تختلف: قد يكون التحرك تصحيحيًا، وليس انعكاسًا حقيقيًا.
هذه النظرة ذات الطبقتين تعطيك سياقًا لا يوفره أي خط بمفرده.
المفهوم الأساسي
المتوسطات المتحركة التقليدية تجيب: "ما هو متوسط السعر على N عمود؟"
هذا المؤشر يجيب: "ما هو متوسط السعر منذ بداية الاتجاه الحالي؟"
المتوسط المتحرك مبني مباشرة على سوبرتريند:
- سوبرتريند يكتشف تغيير الاتجاه
- المؤشر يجد الإغلاق الأقصى للاتجاه السابق (الأعلى للاتجاه الهابط الجديد، الأدنى للاتجاه الصاعد الجديد)
- المتوسط المتحرك يرتكز على تلك النقطة ويحسب للأمام حتى العمود الحالي
- عندما يغير سوبرتريند الاتجاه مرة أخرى، يعيد المتوسط المتحرك التعيين إلى نقطة ارتكاز جديدة
سوبرتريند يحدد الاتجاه. المتوسط المتحرك يقيسه. يعملان كنظام واحد — وليس كأدوات منفصلة.
أنت تختار أي سوبرتريند يقود المتوسط المتحرك:
- الهيكلي — إعادة تعيين أقل، يتتبع الاتجاه الرئيسي
- الأصلي — إعادة تعيين أكثر، يتتبع الزخم قصير الأجل
الميزات الرئيسية
تحليل سوبرتريند مزدوج
- سوبرتريند الهيكلي يحدد اتجاه الاتجاه الرئيسي باستخدام نموذج سوبرتريند متكيف هيكليًا
- سوبرتريند الأصلي يكشف السلوك الاندفاعي مقابل التصحيحي داخل الاتجاه
- المقارنة البصرية تظهر متى يتفق الاثنان (قناعة) ومتى يختلفان (حذر)
متوسط متحرك مرتكز على نقطة ارتكاز متكيف
- المتوسط المتحرك يرتكز تلقائيًا على الإغلاق الأقصى للاتجاه السابق
- الفترة تنمو ديناميكيًا من نقطة الارتكاز — لا حاجة لإعدادات ثابتة
- ثلاثة أنواع من المتوسطات المتحركة: بسيط، أسي، أرنو ليجو (ALMA)
- مرمزة بالألوان حسب اتجاه الاتجاه للتعرف الفوري على الانحياز
سياق متعدد الأطر الزمنية
- تطبيق حساب المتوسط المتحرك على سوبرتريند في إطار زمني أعلى أثناء عرض مخططات الإطار الزمني الأدنى
- رؤية متوسط الاتجاه اليومي على مخطط H1 الخاص بك دون تغيير الإطارات الزمنية
- كشف تلقائي لمتطلبات الأعمدة مع تحذيرات واضحة
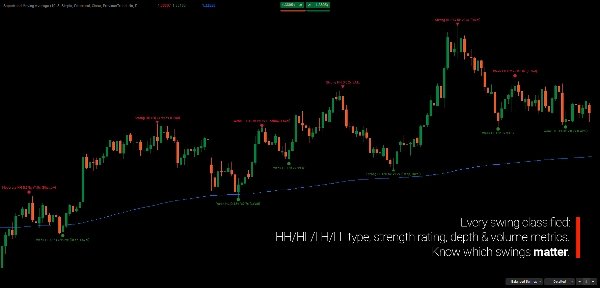
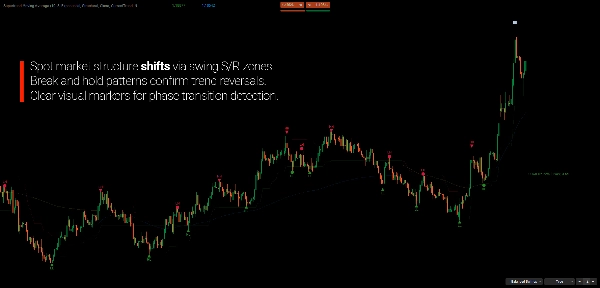
كشف التأرجح المدمج
- ثلاثة أوضاع للكشف: بسيط، متوازن، رئيسي
- تصنيف قوة التأرجح (ضعيف، معتدل، قوي)
- تسميات HH/HL/LH/LL تؤكد هيكل الاتجاه
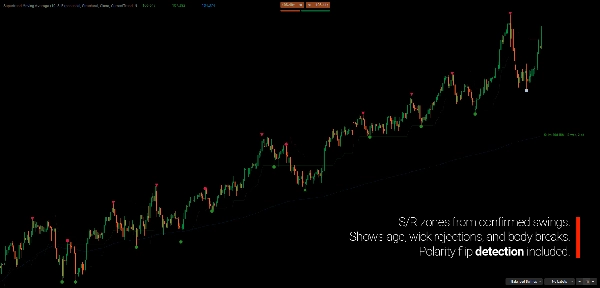
- مناطق دعم/مقاومة اختيارية مع تتبع انقلاب القطبية
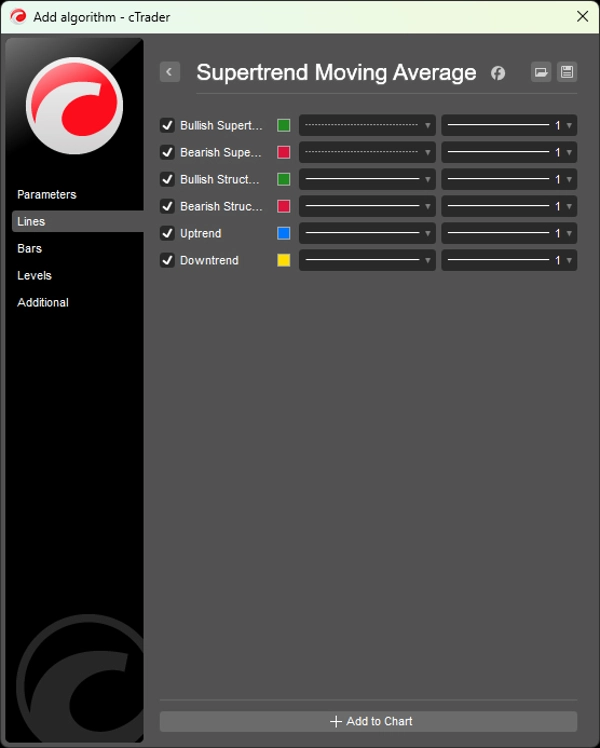
قراءة المخطط
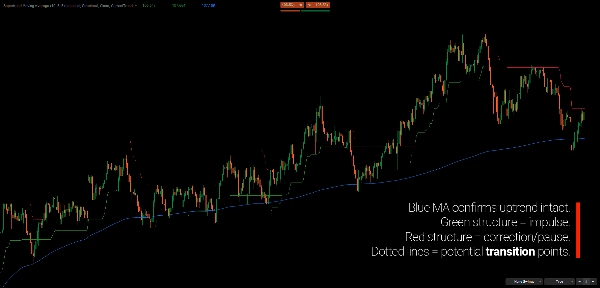
- خط الهيكل الأخضر: اتجاه هيكلي صاعد (دعم)
- خط الهيكل الأحمر: اتجاه هيكلي هابط (مقاومة)
- خط منقط: سوبرتريند الأصلي — يظهر عندما يختلف الهيكل عن الكلاسيكي
- المتوسط المتحرك الأزرق: متوسط الاتجاه الصاعد من نقطة الارتكاز
- المتوسط المتحرك الأصفر: متوسط الاتجاه الهابط من نقطة الارتكاز
- علامات التأرجح: نقاط تحول مؤكدة مع رموز القوة
فحص توافق الاتجاه:
- اتفاق الهيكل + الأصلي → حركة ذات قناعة عالية
- اختلاف الهيكل + الأصلي → تصحيح محتمل أو انتقال
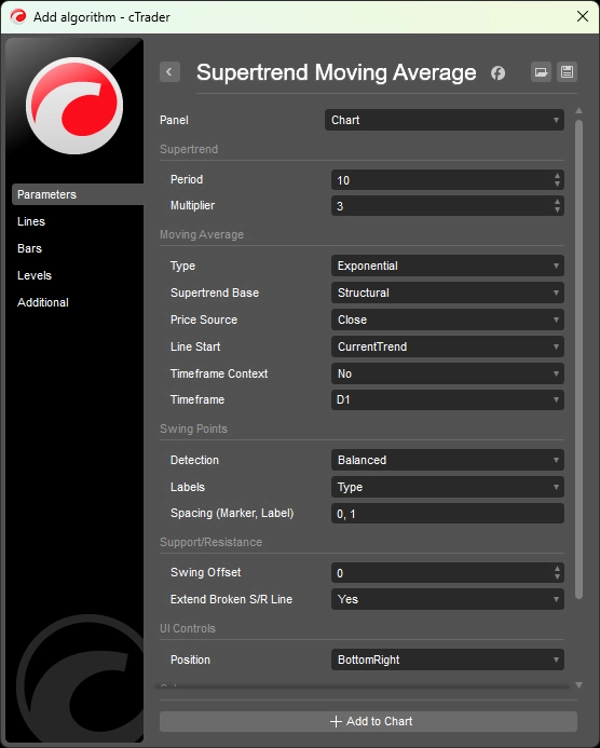
المعلمات
سوبرتريند
- الفترة (الافتراضية: 10)
- المضاعف (الافتراضي: 3.0)
المتوسط المتحرك
- النوع: لا شيء، بسيط، أسي، متوسط متحرك أرنو ليجو (ALMA)
- قاعدة سوبرتريند: هيكلي (افتراضي) أو أصلي
- مصدر السعر: إغلاق، فتح، أعلى، أدنى، متوسط، نموذجي، متوسط
- بداية الخط: الاتجاه الحالي أو الاتجاه السابق
- سياق الإطار الزمني: تمكين/تعطيل مع اختيار الإطار الزمني
نقاط التأرجح
- وضع الكشف: لا شيء، بسيط، متوازن، رئيسي
- عرض التسمية: لا شيء، النوع (HH/LL)، مفصل
- ألوان وتباعد قابلة للتخصيص
لمن هو
هذا المؤشر مصمم للمتداولين الذين يفكرون من حيث الهيكل بدلاً من الإشارات.
إذا كنت تهتم أكثر بفهم موقعك داخل الاتجاه بدلاً من مطاردة نقاط الدخول المثالية، فقد تم بناء هذه الأداة مع وضعك في الاعتبار.
إنه مناسب جيدًا لمتداولي الاتجاه والتأرجح الذين يريدون طريقة موضوعية لتتبع تطور الاتجاه دون الاعتماد على المتوسطات المتحركة ذات الفترات الثابتة أو تحسين المعلمات المستمر.
محللو الأطر الزمنية المتعددة سيستفيدون من رؤية السياق الهيكلي للإطار الزمني الأعلى مباشرة على مخططات التنفيذ، بينما المتداولون التقديريون يمكنهم استخدام المتوسط المتحرك المرتكز كمرجع ديناميكي للتراجعات، والاستمرار، ونفاد الاتجاه.
هذا ليس مولد إشارات جاهز للاستخدام. إنه إطار سياقي للمتداولين الذين يقدرون الوضوح، والاتساق، والمنطق الهيكلي في اتخاذ قراراتهم.
ما الذي يجعله مختلفًا
غالبًا ما تنطوي قرارات التداول على مقايضة مألوفة: سريع لكنه صاخب، أو ناعم لكنه متأخر.
هذا المؤشر يتكيف مع كيفية تطور السوق فعليًا. الاتجاهات القصيرة تنتج متوسطات متحركة سريعة الاستجابة. الاتجاهات الممتدة تتطور طبيعيًا إلى متوسطات أكثر سلاسة. لا حاجة للتحسين — الهيكل يحدد الفترة.
من خلال مقارنة سوبرتريند الهيكلي والأصلي، يوفر المؤشر سياقًا واضحًا للتمييز بين استمرار الاتجاه والحركة التصحيحية داخل الاتجاه.
---
فهم هيكل السوق
هيكل السوق هو دراسة كيفية تطور السعر من خلال تسلسلات من التوسع والانكماش، بدلاً من الشموع أو المؤشرات المعزولة. الاتجاهات لا تُحدد بحركات منفردة، بل بالعلاقة بين التأرجحات — قمم أعلى وقيعان أعلى في الاتجاهات الصاعدة، و قمم أدنى وقيعان أدنى في الاتجاهات الهابطة.
من هذا المنظور، الاتجاه ليس شيئًا للتنبؤ به، بل شيء للمراقبة والتحقق. ما يهم ليس ما إذا كان السعر يرتفع أو ينخفض على العمود الحالي، بل ما إذا كان الهيكل الأساسي لا يزال سليمًا أو يبدأ في التدهور.
لهذا السبب يركز التحليل القائم على الهيكل أقل على توقيت الدخول المثالي وأكثر على السياق: أين يقع السوق ضمن مرحلته الحالية، سواء كانت الحركات اندفاعية أو تصحيحية، وكيف تتناسب المعلومات الجديدة مع الهيكل الموجود.
المؤشرات المبنية حول هيكل السوق ليست مخصصة لاستبدال اتخاذ القرار، بل لدعم تفسير أوضح لما يتواصل به السعر بالفعل.
---
التداول ينطوي على مخاطر. هذا المؤشر هو أداة تحليل فني — دائمًا طبق إدارة مخاطر مناسبة.
الملخص
The indicator integrates dual Supertrend analyses: a Structural Supertrend that identifies major trend direction by filtering out noise and confirming genuine directional changes, and the Original Supertrend that highlights momentum shifts within the trend. Comparing these two provides context for distinguishing strong trend continuation from corrective movements.
Key features include:
- Adaptive anchor-based moving averages with options for Simple, Exponential, or Arnaud Legoux (ALMA) types.
- Multi-timeframe capability to apply higher timeframe Supertrend context on lower timeframe charts.
- Integrated swing detection with configurable modes and strength classification.
- Color-coded trend lines and swing markers for clear visual interpretation.
This tool is suited for trend and swing traders, multi-timeframe analysts, and discretionary traders seeking a structural framework to track trend development and market rhythm objectively. It emphasizes market structure and context over fixed signals, supporting clearer interpretation of price behavior.
تقييمات العملاء
5 | 100 % | |
4 | 0 % | |
3 | 0 % | |
2 | 0 % | |
1 | 0 % |


