
الوصف
ما الذي يفعله
قناة فيبوناتشي تحل مشكلة يتجاهلها معظم أدوات فيبوناتشي: مكان التثبيت أهم من المستويات التي ترسمها.
يقوم معظم المتداولين بتطبيق تصحيحات فيبوناتشي يدويًا — باختيار قمة تأرجح وقاع تأرجح، ورسم الأداة، وأمل أن يبقى الهيكل ثابتًا. النتيجة هي لقطة ثابتة تصبح غير ذات صلة بمجرد أن يدفع السعر خارج أي من الطرفين.
هذا المؤشر يغير النهج.
بدلاً من التثبيت على تأرجح ثابت، تثبت قناة فيبوناتشي على نقطة تختارها وتتتبع باستمرار أعلى قمة وأدنى قاع من تلك النقطة إلى الشمعة الحالية. مع توسع النطاق، تتوسع القناة معه. تعكس مستويات فيبوناتشي دائمًا النطاق الفعلي الذي تم تطويره — وليس تخمينًا تاريخيًا.
تنمو القناة مع السوق. تبقى المستويات ذات معنى.
يتم تتبع الاتجاه تلقائيًا. في السياق الصاعد، تقاس المستويات من الأعلى إلى الأسفل. في السياق الهابط، تقاس من الأسفل إلى الأعلى. لا حاجة لتعديل يدوي — يقرأ المؤشر الهيكل ويوجه نفسه وفقًا لذلك.
لماذا فيبوناتشي المعتمد على التثبيت؟
المشكلة
أدوات فيبوناتشي القياسية تُرسم بين نقطتين ثابتتين. بمجرد أن يتجاوز السعر أيًا من الطرفين، تصبح الأداة غير صالحة — عليك إعادة رسمها يدويًا. هذا يخلق دورة مستمرة من التعديل، ولا تعكس خريطة فيبوناتشي النطاق الكامل الذي تم تطويره فعليًا بدقة.
هناك مشكلة أعمق أيضًا: مكان وضع التثبيت يحدد كل شيء. وضع عشوائي ينتج مستويات عشوائية.
الحل
تعطيك قناة فيبوناتشي تحكمًا متعمدًا في نقطة التثبيت — ثم تتولى كل شيء تلقائيًا من هناك. ضع التثبيت على شمعة ذات معنى هيكلي (بداية اتجاه، انعكاس رئيسي، افتتاح جلسة)، ويبني المؤشر النطاق الكامل للأمام من تلك النقطة. كل قمة أو قاع جديد يصنعه السوق يصبح جزءًا من القناة. تتحدث مستويات فيبوناتشي في الوقت الحقيقي.
التثبيت قابل للسحب. حركه على الرسم البياني، وتُعاد رسم القناة بالكامل فورًا.
لماذا أوضاع متعددة؟
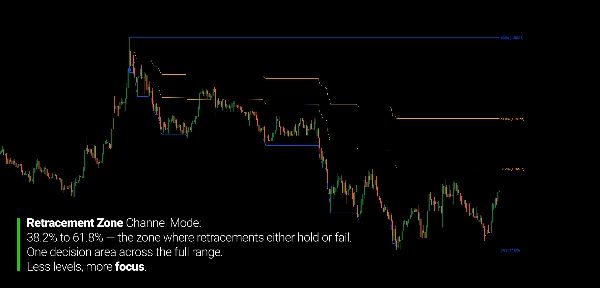
شبكة فيبوناتشي الكاملة ليست دائمًا ما تحتاجه. أحيانًا يكون التركيز على منطقة التصحيح بين 38.2% و61.8%. أحيانًا تريد عزل الهيكل في النصف العلوي أو السفلي فقط من النطاق.
سبعة أوضاع قناة مميزة تتيح لك تطبيق مستوى التفاصيل الذي يتطلبه الموقف — دون ازدحام الرسم البياني بمستويات لا تستخدمها.
المفهوم الأساسي
يعمل المؤشر في تمريرة واحدة للأمام من التثبيت:
- تضع رمز التثبيت على شمعة تختارها
- من تلك الشمعة للأمام، يتتبع المؤشر أعلى قمة وأدنى قاع جاريين
- حدود القناة (الخط الأعلى، الخط الأدنى) تعكس هذا النطاق المتوسع
- يتم حساب مستويات فيبوناتشي ضمن النطاق، موجهة باتجاه الاتجاه
- حرك التثبيت — تعيد القناة الحساب فورًا
يتم تحديد اتجاه الاتجاه بمقارنة الإغلاق الحالي بسعر فتح شمعة التثبيت. صاعد: تقاس المستويات من الأعلى إلى الأسفل. هابط: تقاس المستويات من الأسفل إلى الأعلى. عندما يتغير سياق السوق الاتجاهي، تعيد القناة توجيه نفسها تلقائيًا.
يلتصق التثبيت بأوقات وأسعار فتح الشمعة لوضع نظيف وقابل للتكرار.
أوضاع القناة
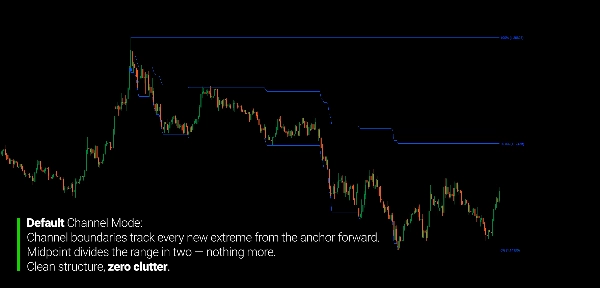
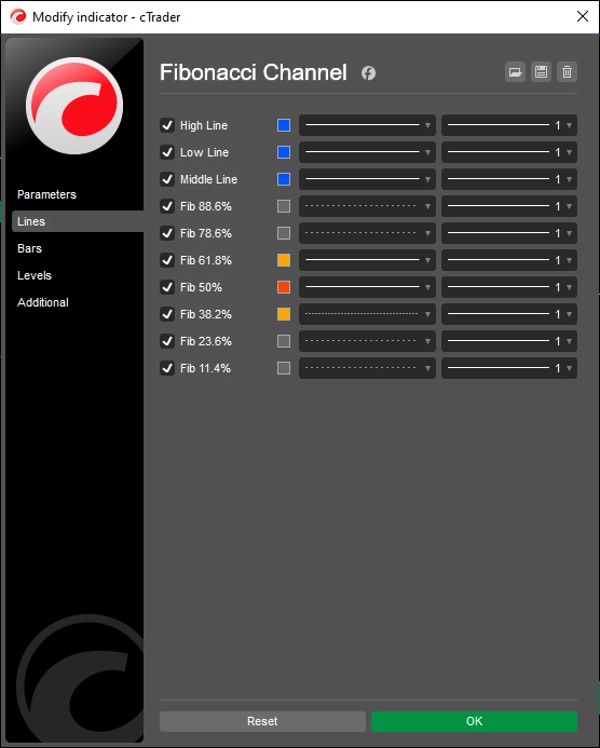
الافتراضي الخط الأعلى، الخط الأدنى، والخط الأوسط فقط. عرض حدود النطاق نظيف بدون مستويات داخلية.
منطقة التصحيح يضيف مستويات 61.8% و38.2% — منطقة التصحيح الأساسية ضمن النطاق الكامل. الأفضل لتحديد منطقة التراجع الرئيسية ضمن الحركة.
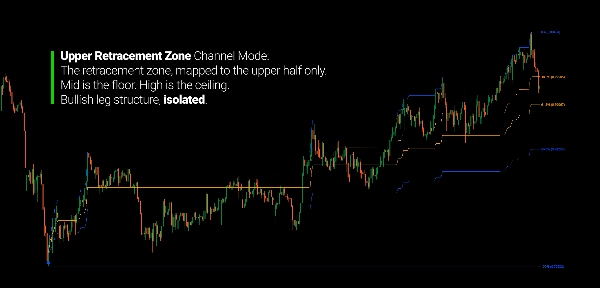
منطقة التصحيح العليا منطقة التصحيح المرسومة على النصف العلوي من القناة (بين الوسط والأعلى). مفيد لعزل هيكل التصحيح ضمن ساق صاعدة.
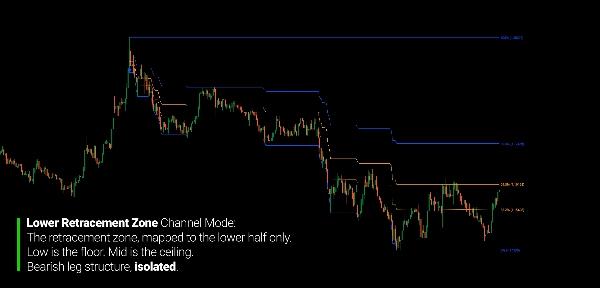
منطقة التصحيح السفلى منطقة التصحيح المرسومة على النصف السفلي (بين الأدنى والوسط). نفس المنطق المطبق على الساق الهابطة.
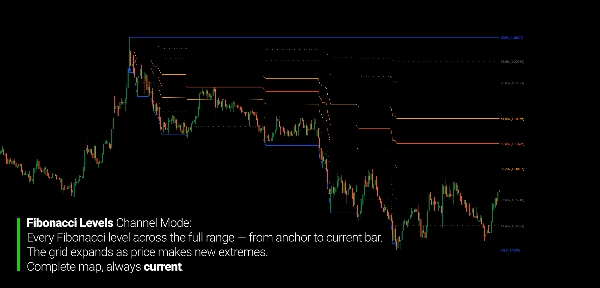
مستويات فيبوناتشي شبكة فيبوناتشي كاملة عبر النطاق الكامل: 88.6%، 78.6%، 61.8%، 50%، 38.2%، 23.6%، 11.4%. للمتداولين الذين يريدون خريطة المستويات الكاملة.
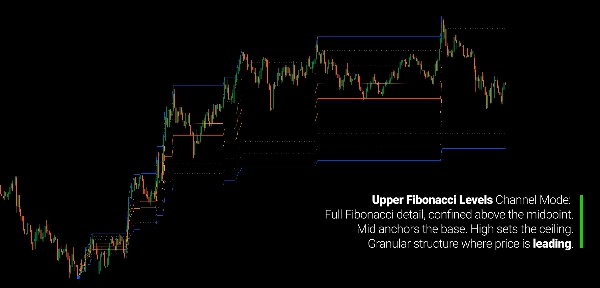
مستويات فيبوناتشي العليا شبكة فيبوناتشي كاملة مطبقة فقط على النصف العلوي من القناة.
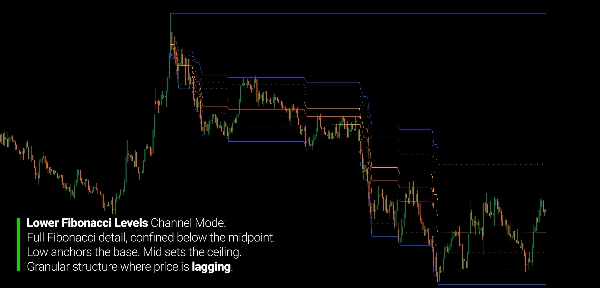
مستويات فيبوناتشي السفلى شبكة فيبوناتشي كاملة مطبقة فقط على النصف السفلي من القناة.
قراءة الرسم البياني
- الخط الأعلى: الحد العلوي للقناة (أعلى قمة من التثبيت)
- الخط الأدنى: الحد السفلي للقناة (أدنى قاع من التثبيت)
- الخط الأوسط: نقطة المنتصف للنطاق الكامل
- 61.8% / 38.2%: منطقة التصحيح الأساسية (خطوط برتقالية)
- 50%: مستوى التصحيح المتوسط (أحمر برتقالي)
- 78.6% / 88.6% / 23.6% / 11.4%: مستويات فيبوناتشي الممتدة (رمادي منقط)
- رمز التثبيت: قابل للسحب — حركه لإعادة تعريف مكان بداية القناة
مرجع الاتجاه:
- السياق الصاعد → المستويات موجهة من الأعلى إلى الأسفل (الأعلى = 0%، الأدنى = 100%)
- السياق الهابط → المستويات موجهة من الأسفل إلى الأعلى (الأدنى = 0%، الأعلى = 100%)
- يتم تحديث الاتجاه تلقائيًا عندما يتقاطع الإغلاق الأخير مع فتح التثبيت
المعلمات
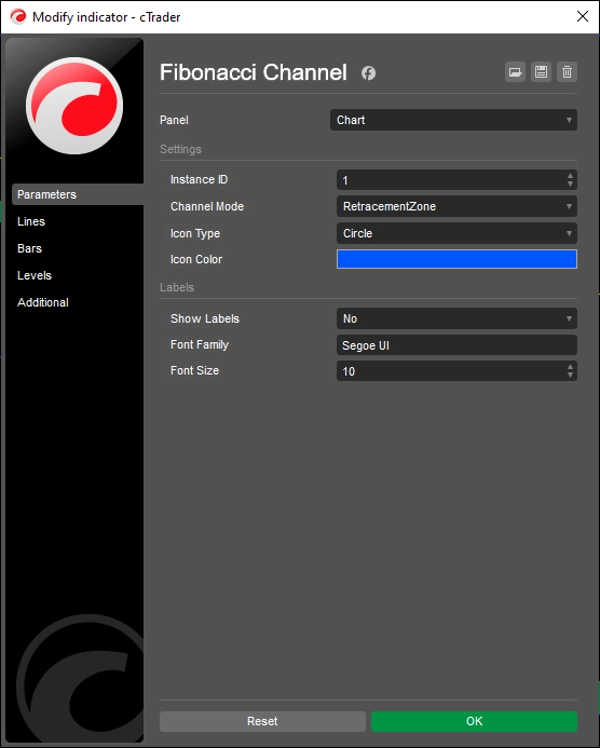
الإعدادات
- معرف النسخة — يدعم قنوات مستقلة متعددة على نفس الرسم البياني
- وضع القناة — يحدد المستويات التي ستعرض (7 أوضاع)
- نوع الرمز — النمط البصري لرمز التثبيت القابل للسحب
- لون الرمز — لون علامة التثبيت
التسميات
- إظهار التسميات — تبديل تسميات الأسعار عند كل مستوى
- عائلة الخط — نوع الخط للتسمية
- حجم الخط — حجم التسمية (6–32)
لمن هو
هذا المؤشر مخصص للمتداولين الذين يستخدمون تحليل فيبوناتشي كمرجع هيكلي بدلاً من أداة إشارة ميكانيكية.
إذا قضيت وقتًا في إعادة رسم أدوات فيبوناتشي في كل مرة يصنع فيها السعر قمة أو قاع جديد — أو وجدت أن التصحيحات الثابتة تتوقف عن عكس السوق بعد أول بضع شموع — فقد تم بناء هذا المؤشر لمعالجة ذلك بالضبط.
إنه مناسب جيدًا لـ متداولي التأرجح والمراكز الذين يريدون خريطة فيبوناتشي تبقى صالحة مع تطور السعر، متداولي النطاق والهيكل الذين يعملون مع حدود القناة ومناطق التصحيح كمرجع للدخول أو الخروج، و المستخدمين متعددين النسخ الذين يريدون تتبع قنوات مستقلة متعددة عبر نفس الأداة في نفس الوقت.
يجعل التثبيت القابل للسحب هذا عمليًا في الاستخدام في الوقت الحقيقي: حدد بداية القناة عند نقطة ذات معنى هيكلي، ودع المؤشر يحافظ على الخريطة من هناك. لا إعادة رسم، لا تحديثات يدوية.
هذا ليس مولد إشارات. إنه إطار مرجعي هيكلي للمتداولين الذين يستخدمون مستويات فيبوناتشي كالسياق — وليس كمحفزات دخول.
ما الذي يجعله مختلفًا
معظم أدوات فيبوناتشي ثابتة: نقطتان ثابتتان، خريطة واحدة ثابتة. هذا المؤشر ديناميكي — يتوسع النطاق مع تطور السعر، وتعكس المستويات دائمًا النطاق الفعلي من التثبيت الذي اخترته إلى الشمعة الحالية.
تتطلب معظم تطبيقات فيبوناتشي إعداد الاتجاه يدويًا. هذا المؤشر يقرأ السياق الصاعد والهابط تلقائيًا ويوجه كل المستويات وفقًا لذلك — دون أي تغييرات في المعلمات من المتداول.
تقدم معظم أدوات القناة تخطيطًا واحدًا. هذا يقدم سبعة أوضاع مميزة، من عرض حدود نظيف إلى شبكة فيبوناتشي كاملة مطبقة على النطاق الكامل أو أي نصف بشكل مستقل. يظهر الرسم البياني بالضبط مستوى التفاصيل الذي تحتاجه للسياق الذي تحلله.
يمكن تشغيل نسخ متعددة في نفس الوقت مع تثبيتات مستقلة — كل منها يتتبع مقطع هيكلي مختلف دون التداخل مع الآخر.
---
فهم هيكل فيبوناتشي
نسب فيبوناتشي ليست تنبؤية. إنها تصف العلاقات النسبية ضمن نطاقات الأسعار — علاقات لاحظ المتداولون تكرارها عبر الأسواق والأطر الزمنية لعقود. سواء كان هذا يعكس خصائص رياضية للأسواق أو ببساطة سلوكًا جماعيًا حول مستويات معروفة هو سؤال مفتوح. ما يهم للاستخدام العملي هو أكثر وضوحًا.
تعرف قناة فيبوناتشي نطاق الحركة وتقسمه إلى مناطق ذات معنى نسبي. يستخدم المتداولون هذه المناطق لتقييم ما إذا كان التراجع سطحيًا أو عميقًا، وما إذا كان التصحيح مستمرًا أو فاشلًا، وما إذا كان السعر يقترب من منطقة كان الهيكل فيها مهمًا تاريخيًا.
قيمة النهج المعتمد على التثبيت هي أنه يبقي التحليل مرتبطًا بحدث هيكلي محدد. لا تبدأ القناة عند نقطة عشوائية — تبدأ حيث تقرر أن الحركة ذات الصلة بدأت. هذا القرار يعود لك بناءً على قراءتك للرسم البياني. دور المؤشر هو الحفاظ على الخريطة بدقة من تلك النقطة فصاعدًا، بحيث تبقى المستويات صالحة طالما بقي الهيكل الذي يقيسه سليمًا.
---
التداول ينطوي على مخاطر. هذا المؤشر هو أداة تحليل فني — طبق دائمًا إدارة مخاطر مناسبة.
الملخص
تقييمات العملاء
5 | 100 % | |
4 | 0 % | |
3 | 0 % | |
2 | 0 % | |
1 | 0 % |


![شعار "[Stellar Strategies] Inside Bar with Signals"](https://cdn.ctrader.com/image/webp/1d9e8bfa-3b2c-4440-bb37-5856902008a7_30683)


