
Liquidity Cluster Order
مؤشر
2 عمليات الشراء
الإصدار 1.0، Nov 2025
Windows, Mac
5.0
التقييمات: 1
الوصف
أمر تجمع السيولة (LCO) 🔍💧
1. ما الذي يظهره LCO
أمر تجمع السيولة يكتشف ويرسم تلقائيًا:
- تجمعات السيولة الصاعدة (مناطق الطلب / التراكم المحتملة) ✅
- تجمعات السيولة الهابطة (مناطق العرض / التوزيع المحتملة) 🔻
كل تجمع هو:
- مرتكز على شريط محور الحجم (أقصى حجم محلي)،
- مصنف كـ صاعد أو هابط بناءً على امتداد السعر الأخير،
- ممدود إلى الأمام في الزمن حتى يقوم السعر بتخفيف (استهلاك) التجمع.
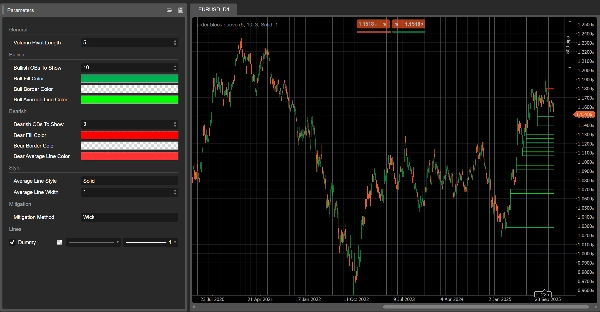
على الرسم البياني ترى:
- مستطيلات خضراء → تجمعات السيولة الصاعدة
- مستطيلات حمراء → تجمعات السيولة الهابطة
- خط رمادي داخل كل مستطيل → مستوى السعر المتوسط لذلك التجمع
بمجرد اعتبار التجمع مخففًا، يختفي من الرسم البياني وتبقى التجمعات النشطة فقط.
2. منطق الكشف (بعبارات بسيطة)
- محور الحجم
-
- يقوم LCO بمسح الأشرطة حيث الحجم أعلى من أشرطة
طول محور الحجمالسابقة واللاحقة. - هذه الأشرطة هي محاور حجم – نقاط ارتكاز محتملة لتجمعات السيولة.
- يقوم LCO بمسح الأشرطة حيث الحجم أعلى من أشرطة
- السياق: صاعد مقابل هابط
-
- السلوك السعري الأخير يحدد السياق:
-
- السياق الصاعد → سيطر الامتداد الهبوطي.
- السياق الهابط → سيطر الامتداد الصعودي.
- هذا السياق يحدد ما إذا كان محور الحجم التالي سيخلق تجمعًا صاعدًا أو تجمعًا هابطًا للسيولة.
- تجمع السيولة الصاعد
في سياق صاعد: -
- أسفل التجمع = أدنى نقطة لشريط المحور
- أعلى التجمع = منتصف الشريط (
(الأعلى + الأدنى) / 2) - التفسير: المنطقة التي تم فيها امتصاص الضغط الهبوطي ودخل المشترون بقوة.
- تجمع السيولة الهابط
في سياق هابط: -
- أسفل التجمع = منتصف شريط المحور
- أعلى التجمع = أعلى نقطة لشريط المحور
- التفسير: المنطقة التي تم فيها امتصاص الضغط الصعودي وسيطر البائعون.
- الخط المتوسط
-
- لكل تجمع، يحسب LCO متوسط الأعلى والأسفل ويرسم خطًا رماديًا متوسطًا.
- يعمل هذا كـ مستوى توازن داخلي للتجمع.
- التخفيف (استهلاك التجمع)
في كل شريط جديد، يتحقق LCO مما إذا كان التجمع مخففًا: -
- بالنسبة لـ التجمعات الصاعدة:
-
- يتتبع هدف سعر هبوطي على مدى
طول محور الحجممن الأشرطة: -
طريقة التخفيف = الفتيل→ أدنى أدنى سعر.طريقة التخفيف = الإغلاق→ أدنى سعر إغلاق.
- إذا انخفض هذا السعر الهدف أسفل أسفل التجمع، يعتبر التجمع الصاعد مخففًا ويتم إزالته.
- يتتبع هدف سعر هبوطي على مدى
- بالنسبة لـ التجمعات الهابطة:
-
- يتتبع هدف سعر صعودي :
-
الفتيل→ أعلى أعلى سعر.الإغلاق→ أعلى سعر إغلاق.
- إذا ارتفع هذا السعر الهدف فوق أعلى التجمع، يعتبر التجمع الهابط مخففًا ويتم إزالته.
مخفف = يُفترض أن السيولة في ذلك التجمع مستهلكة / ملغاة.
3. كيفية قراءة LCO على الرسم البياني
سترى بشكل رئيسي:
- تجمعات خضراء أسفل السعر → مناطق سيولة طلب محتملة
- تجمعات حمراء فوق السعر → مناطق سيولة عرض محتملة
قراءة نموذجية (ليست نصيحة تداول):
- تجمعات جديدة
-
- التجمعات التي تم إنشاؤها مؤخرًا غالبًا ما تكون أكثر صلة:
-
- تجمع صاعد أسفل السعر → المنطقة التي امتص فيها المشترون آخر ضغط بيع.
- تجمع هابط فوق السعر → المنطقة التي امتص فيها البائعون آخر ضغط شراء.
- إعادة اختبار التجمع
-
- يعود السعر إلى تجمع صاعد من الأعلى:
-
- إذا تفاعل السعر وثبت عند القاع → احتمال ارتداد / منطقة رد فعل شراء.
- يعود السعر إلى تجمع هابط من الأسفل:
-
- إذا فشل السعر في التداول فوق القمة → احتمال رفض / منطقة رد فعل بيع.
- التجمعات المخففة مقابل النشطة
-
- عندما يخترق السعر تجمعًا خارج حدوده وفقًا لطريقة التخفيف المختارة،
→ يتم إزالة ذلك التجمع في الأشرطة التالية. - التجمعات التي لا تزال مرئية هي مناطق سيولة نشطة لم يتم التداول من خلالها بالكامل بعد.
- عندما يخترق السعر تجمعًا خارج حدوده وفقًا لطريقة التخفيف المختارة،
- استخدام الخط المتوسط
-
- يمكن استخدام ذلك الخط الرمادي المتوسط كـ:
-
- مستوى جني أرباح أو خروج جزئي داخل التجمع،
- مرجع "سعر عادل" داخل منطقة السيولة،
- طريقة سريعة لمعرفة ما إذا كان السعر يتداول في النصف العلوي أو السفلي من التجمع.
4. المعلمات (بالإنجليزية)
طول محور الحجم
- الأشرطة المستخدمة لـ:
-
- كشف محاور الحجم،
- حساب القيم القصوى وهدف التخفيف.
- القيم الأقل → المزيد من التجمعات، المزيد من الضوضاء؛
- القيم الأعلى → تجمعات أقل وأكثر أهمية.
تجمعات السيولة الصاعدة للعرض
(سابقًا عروض صاعدة للعرض)
- الحد الأقصى لعدد التجمعات الصاعدة المعروضة على الرسم البياني.
تجمعات السيولة الهابطة للعرض
(سابقًا عروض هابطة للعرض)
- الحد الأقصى لعدد التجمعات الهابطة المعروضة.
لون تعبئة الصعود / لون تعبئة الهبوط
- لون تعبئة التجمعات الصاعدة/الهابطة.
- يمكنك تضمين قيم ألفا (الشفافية).
لون الخط المتوسط للصعود/الهبوط
- لون الخط المتوسط الداخلي لكل تجمع.
نمط الخط المتوسط
- النمط البصري للخط المتوسط:
"صلب"،"متقطع"،"منقط".
عرض الخط المتوسط
- سمك الخط المتوسط.
طريقة التخفيف
"الفتيل"→ التخفيف بناءً على فتائل الأعلى/الأدنى (أكثر حساسية)."الإغلاق"→ التخفيف بناءً على أسعار الإغلاق (أكثر تحفظًا).
الملخص
ملخص الذكاء الاصطناعي
Liquidity Cluster Order (LCO) is a trading indicator that automatically identifies and visualizes key liquidity zones on price charts. It detects bullish liquidity clusters (potential demand or accumulation zones) and bearish liquidity clusters (potential supply or distribution zones) by anchoring each cluster on volume pivot bars—local volume maxima—and classifies them based on recent price extensions.
On the chart, bullish clusters appear as green rectangles below the price, indicating areas where buyers absorbed selling pressure. Bearish clusters are shown as red rectangles above the price, marking zones where sellers absorbed buying pressure. Each cluster includes a grey mid-line representing the average price level, serving as an internal equilibrium reference.
Clusters extend forward in time until price "mitigates" or consumes them, at which point they disappear, leaving only active liquidity zones visible. Mitigation is determined by tracking price extremes (high/low wicks or closing prices) over a configurable number of bars.
Key parameters include the volume pivot length (defining sensitivity and cluster significance), maximum clusters displayed, cluster colors, mid-line style, and mitigation method. LCO supports various markets including forex, indices, commodities, stocks, and cryptocurrencies, and integrates with multiple trading strategies and indicators such as RSI, MACD, Bollinger Bands, and Fibonacci levels.
ملف تعريف المؤشر
تقييمات العملاء
5.0
التقييمات: 1
5 | 100 % | |
4 | 0 % | |
3 | 0 % | |
2 | 0 % | |
1 | 0 % |
تقييمات العملاء
November 18, 2025
Two timeframes give more context. The first signal should not decide the only input.
مناقشة
الأسئلة الشائعة
Signal
Indices
Commodities
GBPUSD
RSI
Bollinger
Fibonacci
Scalping
AI
XAUUSD
NAS100
MACD
BTCUSD
Forex
Breakout
EURUSD
NZDUSD
Martingale
Prop
Supertrend
Fair Value Gap
SMC
Crypto
Grid
Stocks
ATR
USDJPY
VWAP
يتم توفير المنتجات المتاحة من خلال cTrader Store، بما في ذلك روبوتات التداول والمؤشرات والإضافات، من قبل مطوري الطرف الثالث وإتاحتها لأغراض الوصول المعلوماتي والفني فقط. cTrader Store ليس وسيطًا ولا يقدم نصائح استثمارية أو توصيات شخصية أو أي ضمان للأداء المستقبلي.


السعر
42.11M
حجم التداول
6.13M
الربح بالبيب
228
المبيعات
8.47K
التثبيتات المجانية